How to Pull and Export Amazon Seller Central Data: A Guide
There’s a gold mine of business knowledge hidden within Amazon Seller Central reporting. The Amazon seller data collected and provided through downloadable reports can help you spot missed opportunities, inefficiencies, and ideas for future product development that could fuel your company’s future growth.
But first, you need to access it. This guide will break down how to export your Amazon seller data, as well as what your options are for aggregating it if manual download isn’t enough.
How to Pull Data From Amazon Seller Central
Accessing Amazon seller data through your Amazon dashboard is straightforward. Getting the reports and data you want, however, is a little bit complicated. But first, we'll take you step-by-step through the process of accessing Amazon Seller Central data.
Step 1: Login
Log in to your Amazon dashboard and click on "Reports" on your menu bar, and then choose "Business Reports" from the drop-down menu.
Step 2: Browse for Your Report Type on the Menu
On the left-hand side, you'll see a menu. This lists all of the types of Amazon seller data reports available to you. You can get them organized by date or by ASIN, or view your sales and orders by month.
Step 3: Click on the Report Type You Want
Let's say you want to see sales and traffic on a specific date. Click on the "sales and traffic" option in that menu.
Step 4: Adjust the Date and Other Parameters
Just like that, you're in the report. You can choose a specific date and view your total Amazon sales by product category. You can see the total items ordered, the ordered product sales, the average sales per order item, and other stats for that day.
Step 5: Download
After that, exporting your Amazon data is easy: you just click on the "Download" button in the top right.
What If I Want More Detailed Data on Multiple Products?
If you're just wondering how to find sales volume on Amazon, this method works fine for an individual day or even a range of dates for a high-level overview. But for most companies who sell through Amazon, they often want to better understand performance at a more granular level using Amazon seller data.
As an example, it’s very easy to know that you sold 55 units and drove $22,341.59 in revenue over a period. It’s more difficult to understand (especially if you have a large catalog) what’s trending up and down and whether it’s just product A exploding in sales while products B-F are slumping.
So what if you want to do time comparisons like month-over-month or year-over-year for specific products?
To see trends for individual products over a specific time period, the solution is simple, but tedious and time-consuming:
Download the individual report for each day you want to compare.
Label each report for the day it represents (because Amazon doesn't automatically do this).
Manually combine all the reports into one big, new report.
As you can imagine, that takes quite a while. Here is what this data looks like on the Amazon side, as well as what it looks like in the reports we provide our clients.
What Data Looks Like in Seller Central
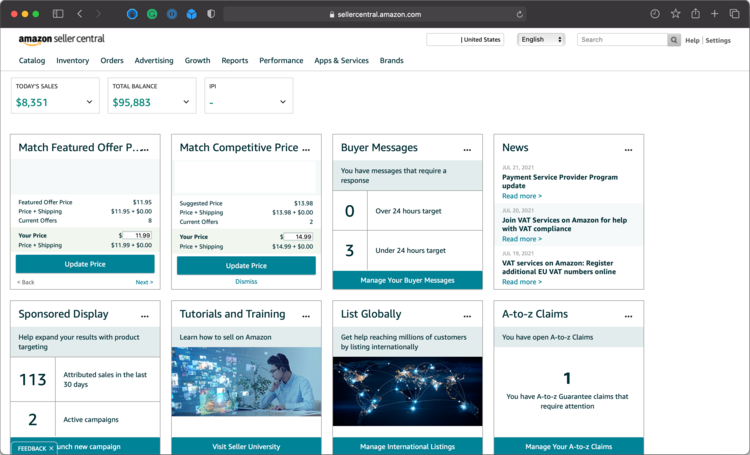
Here is a screenshot of how your Amazon seller data appears within Amazon Seller Central. As you can see, it’s fairly limited in terms of how you can sort the data and there’s no way to do detailed comparisons of various date ranges. So while this will provide you with snapshots of your data on individual dates, this doesn’t really help you if you are trying to conduct detailed analysis of your business metrics.
What Reason Automation Client Data Looks Like
Below are screenshots of how Reason Automation provides Seller Central data to our clients. Because we provide the raw data in spreadsheets directly to our clients, they are able to own the data and use it how they want to. They can plug this raw data directly into data visualization platforms like Power BI, Tableau, and Google Data Studio to easily conduct analysis for their business. They don’t have to manually download each report and combine them; all that work is done for them.
Aggregating Amazon Data Isn't Easy, But There Are Options
If you were hoping to discover some easy way to break down Amazon data through their dashboard in the way you need as a seller, the disappointing truth is that it's just not possible. Amazon's reports are straightforward to access, but they only provide snapshots at a time. Amazon sellers, like any business, need to compare individual product data and stretch it out over a week, month, year, and beyond. You can crunch the data yourself, but most business owners and managers simply don't have the time.
The good news is there are plenty of services out there that will do it for you. Connectors and data aggregators can pull this data into one place to help you handle it all. Download our free whitepaper below for a breakdown of what methods are available to you so you can determine the right one for your business.
READ MORE:
Turn Amazon Data into a strategic Asset
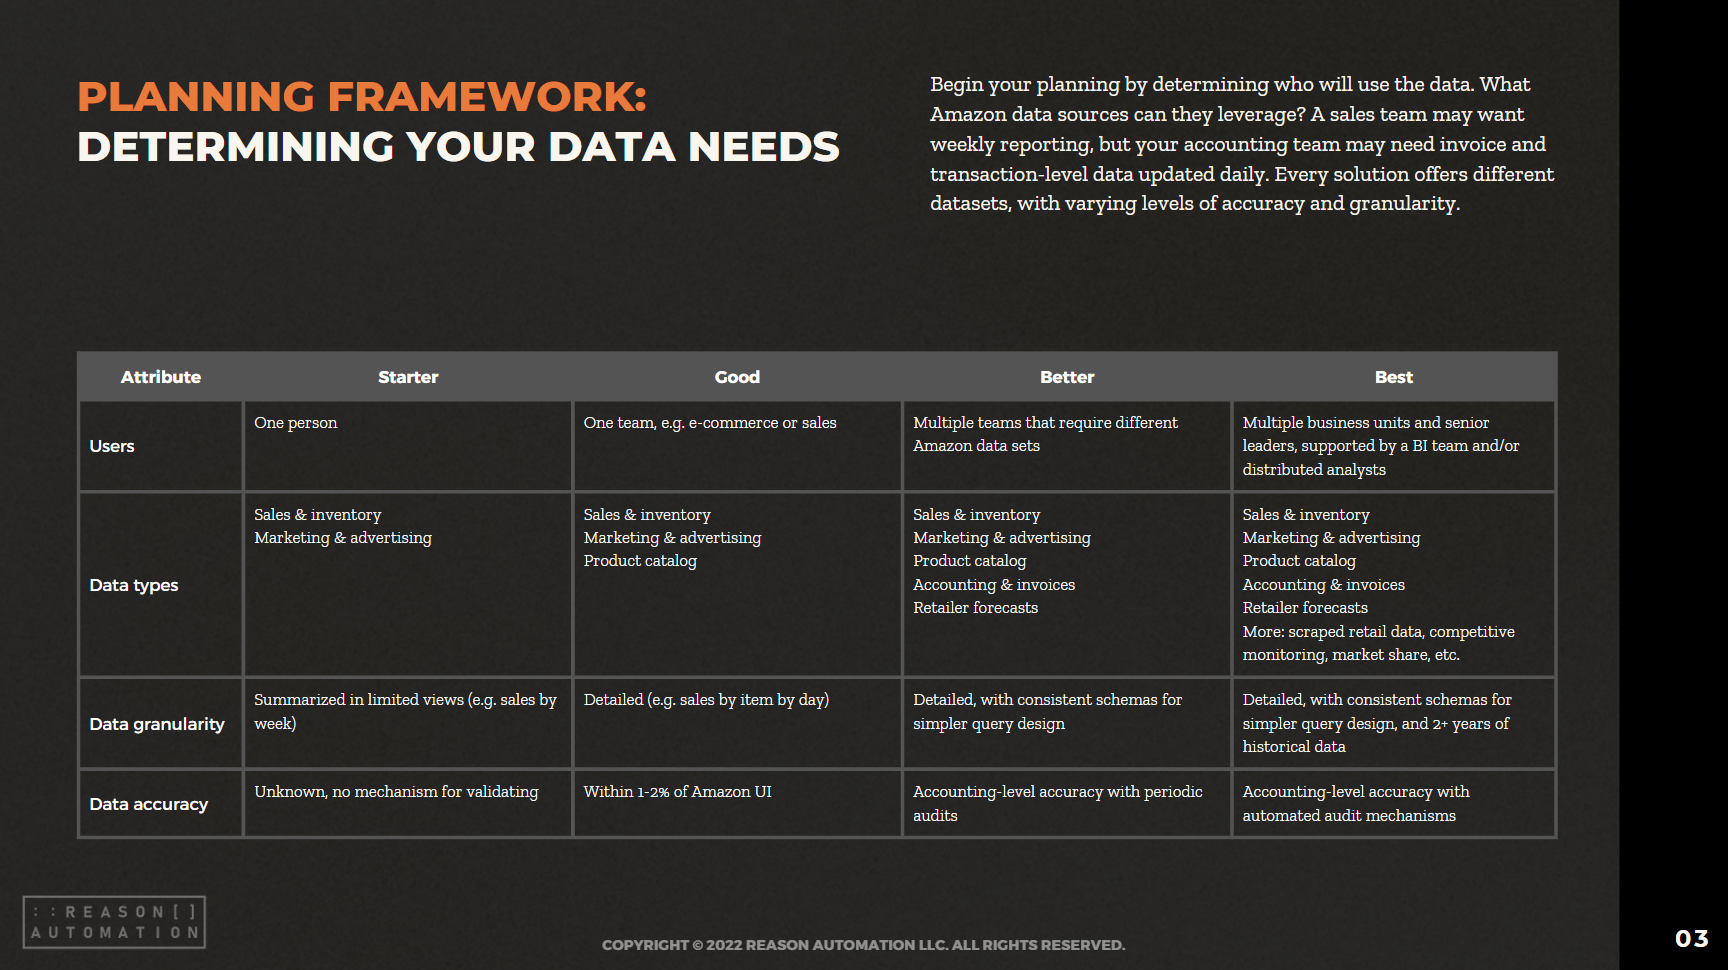
The breadth of Amazon sales, marketing, and supply chain data lets brands find patterns and insights to optimize their Amazon business and other e-commerce channels. But only if you have a plan for extracting the data from Amazon systems, storing it, and preparing it for analysis.
This guide will help you take ownership of your Amazon data—by preparing your business for a data-driven future, and analyzing the most common methods for extraction, automation, storage, and management.


