Amazon Seller Central Power BI template
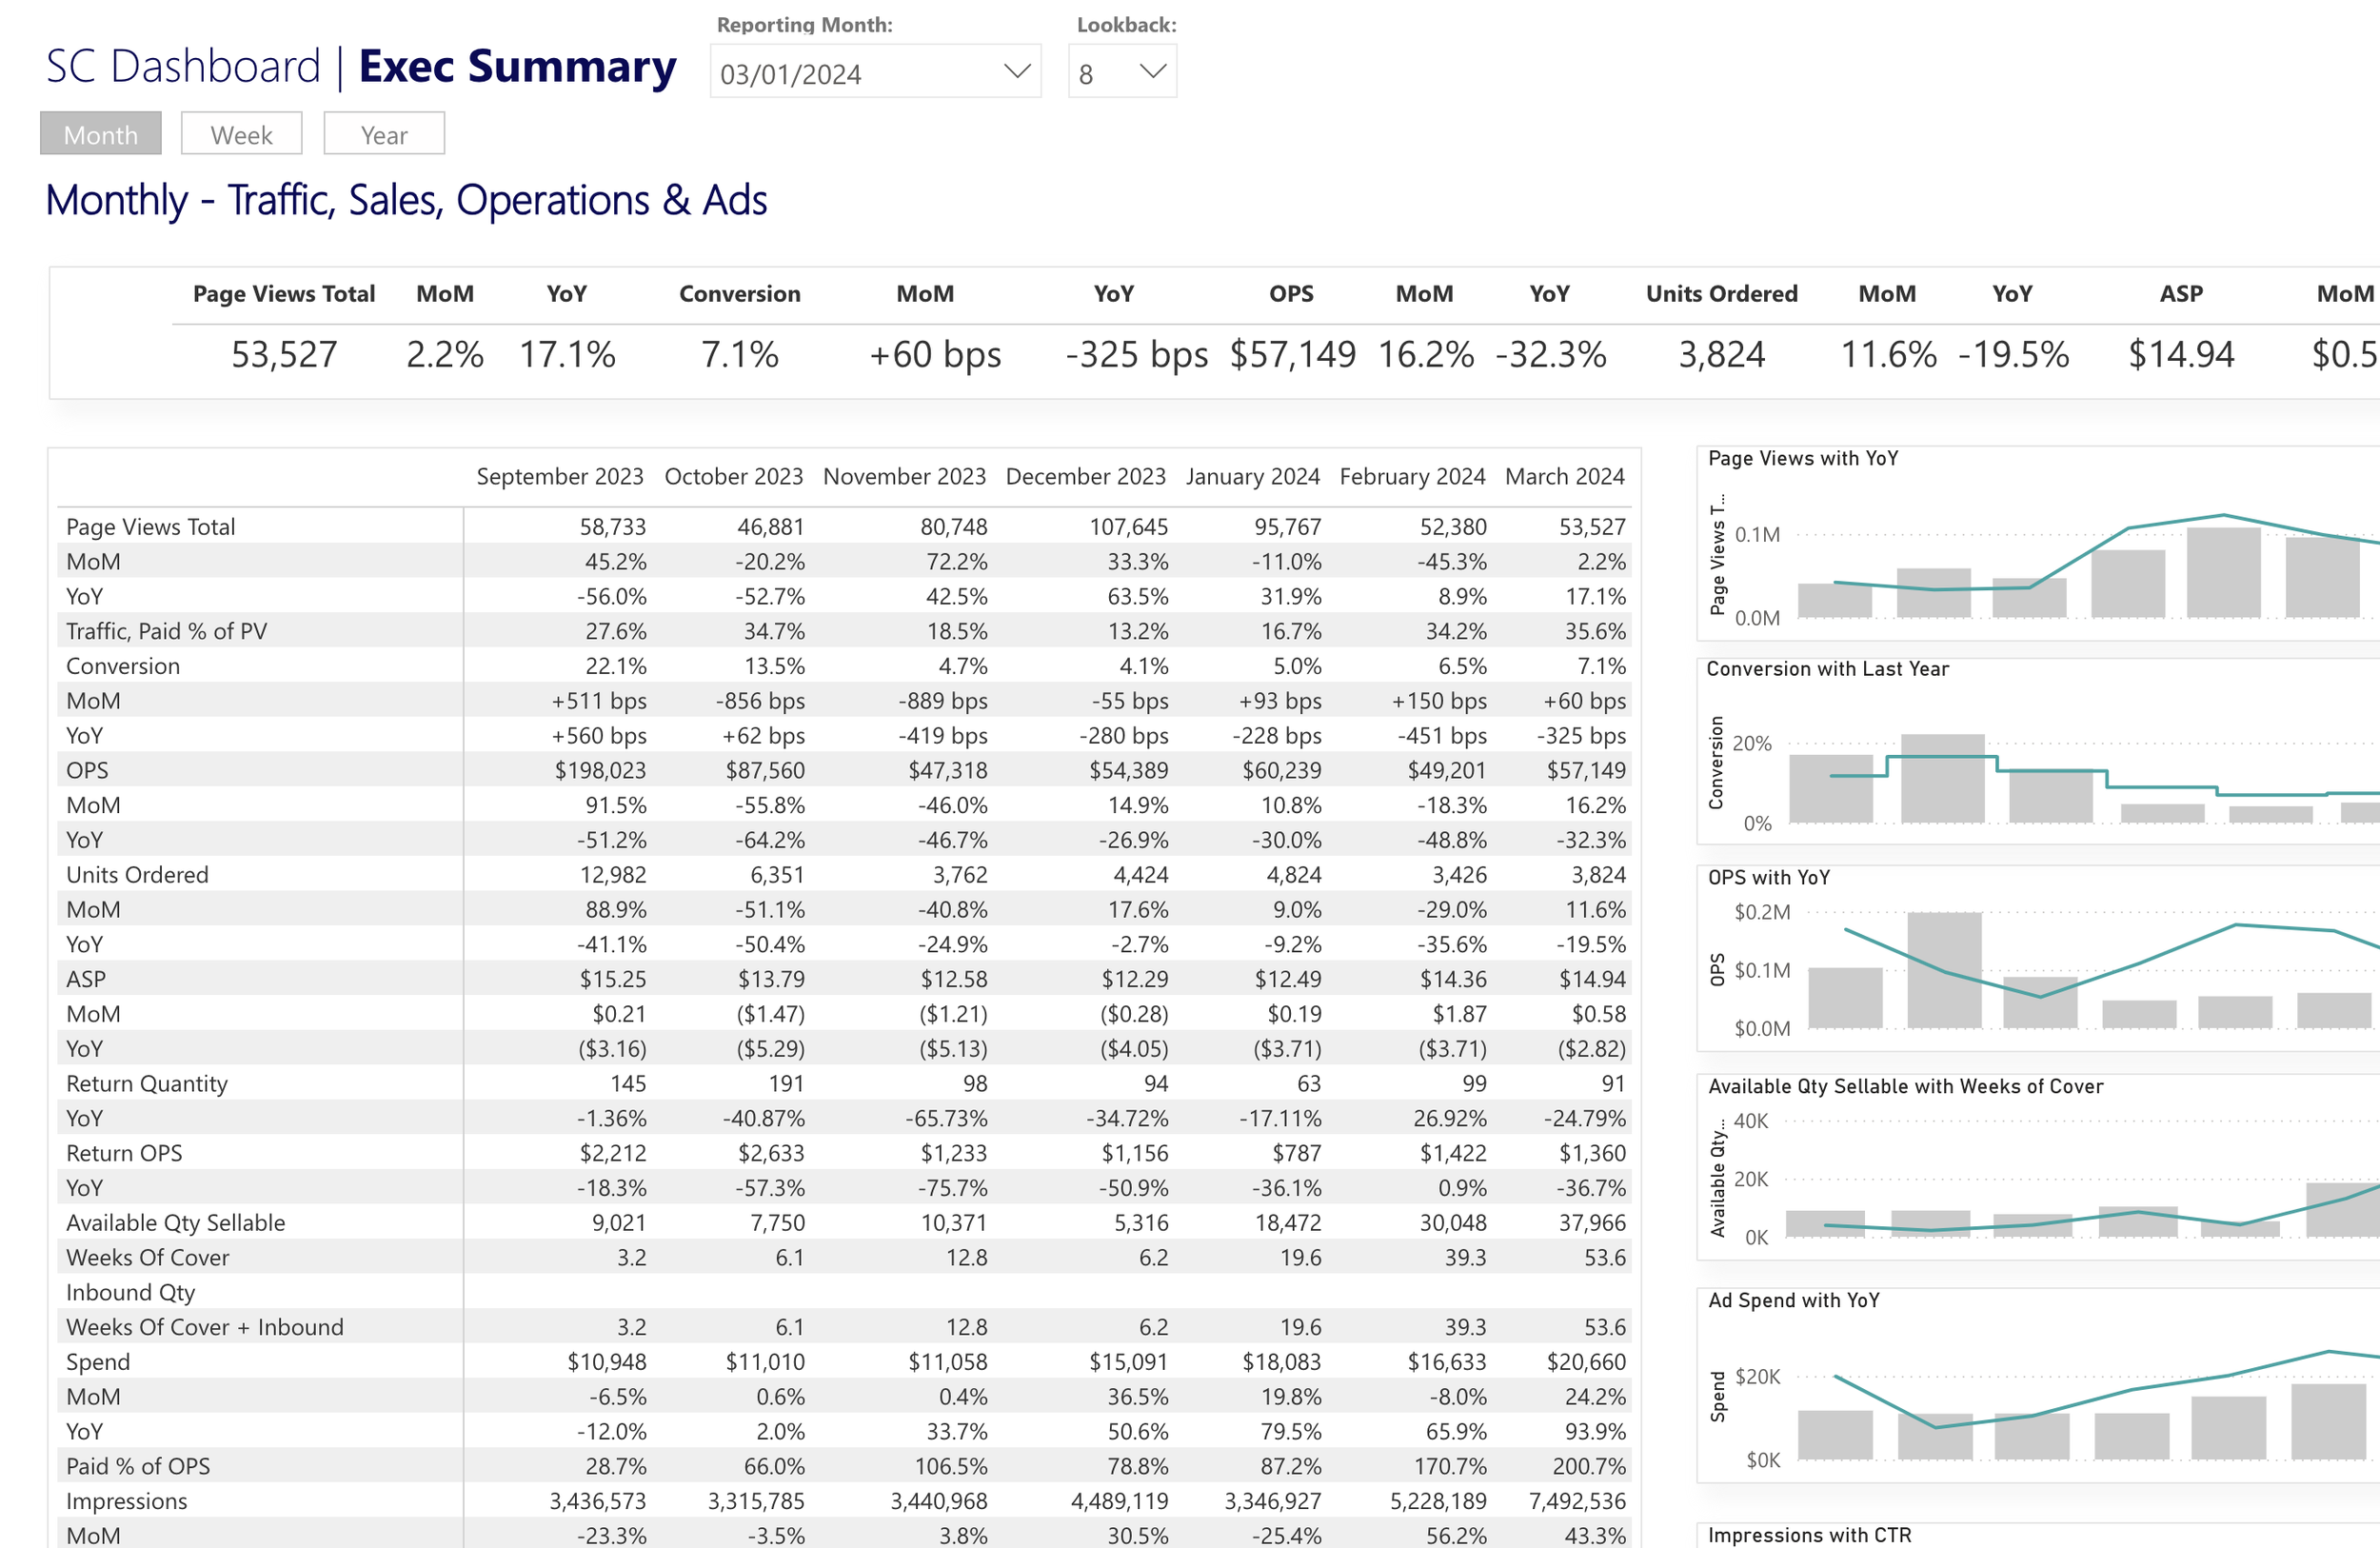
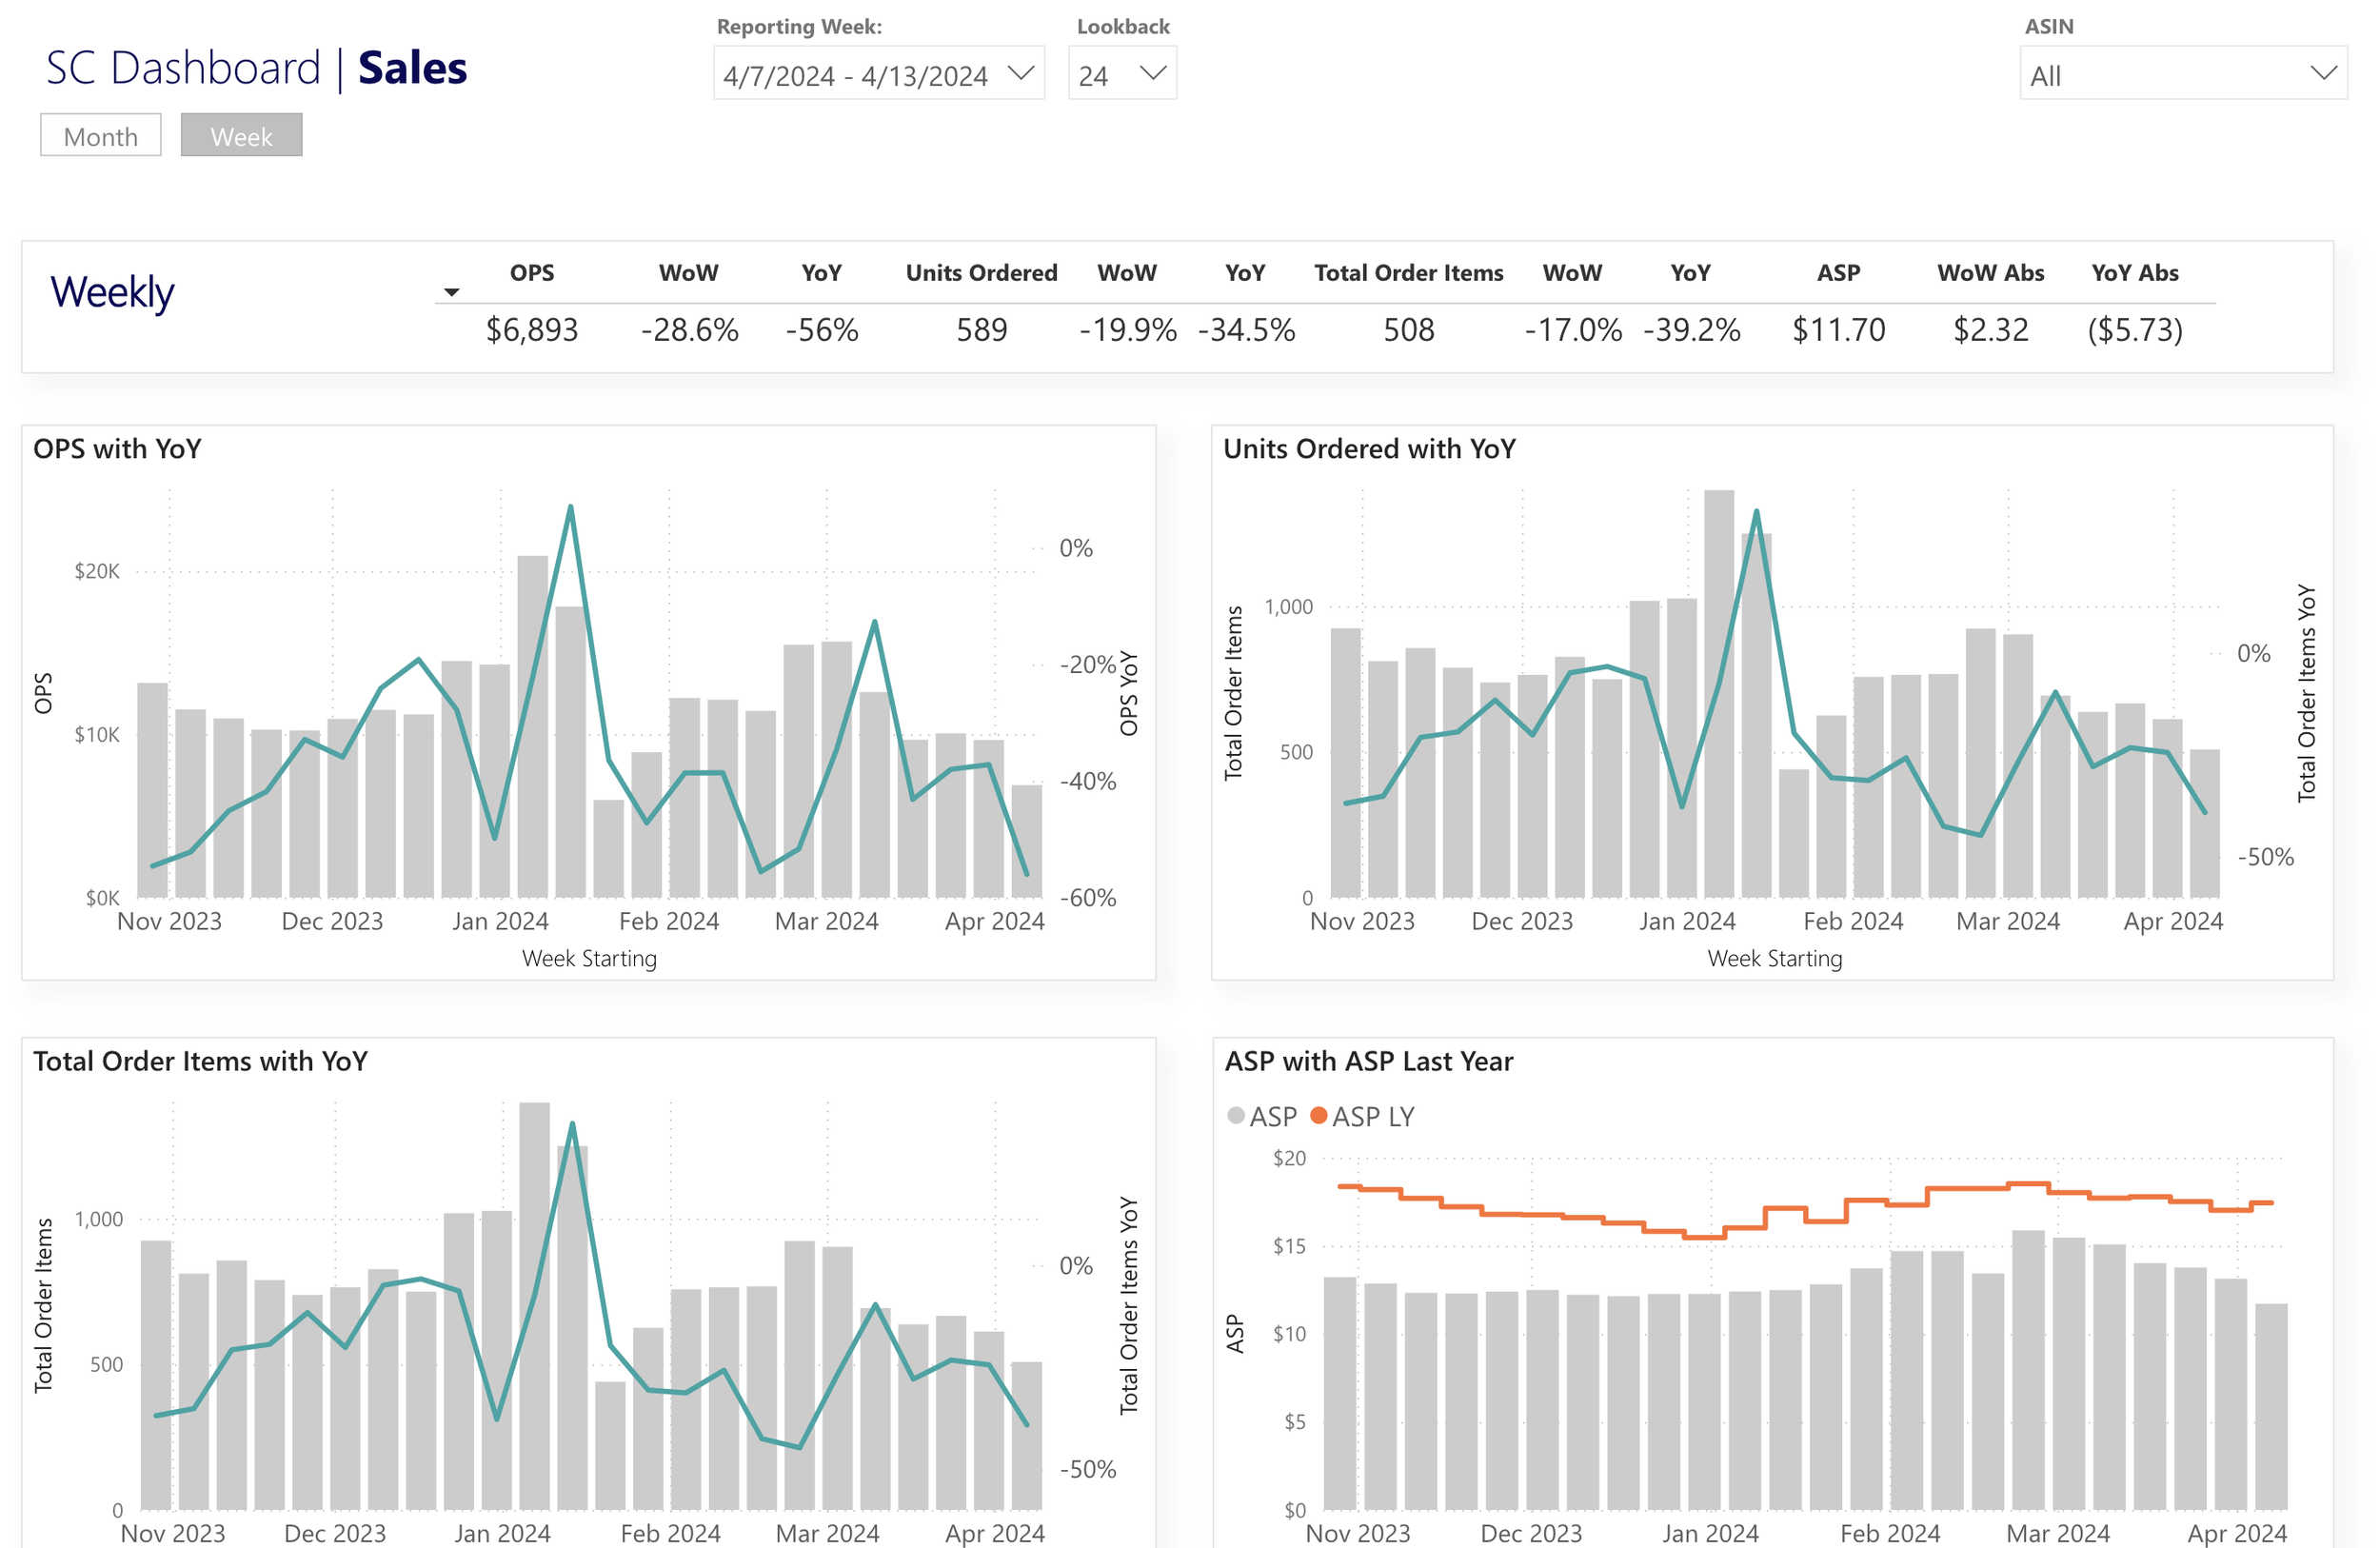
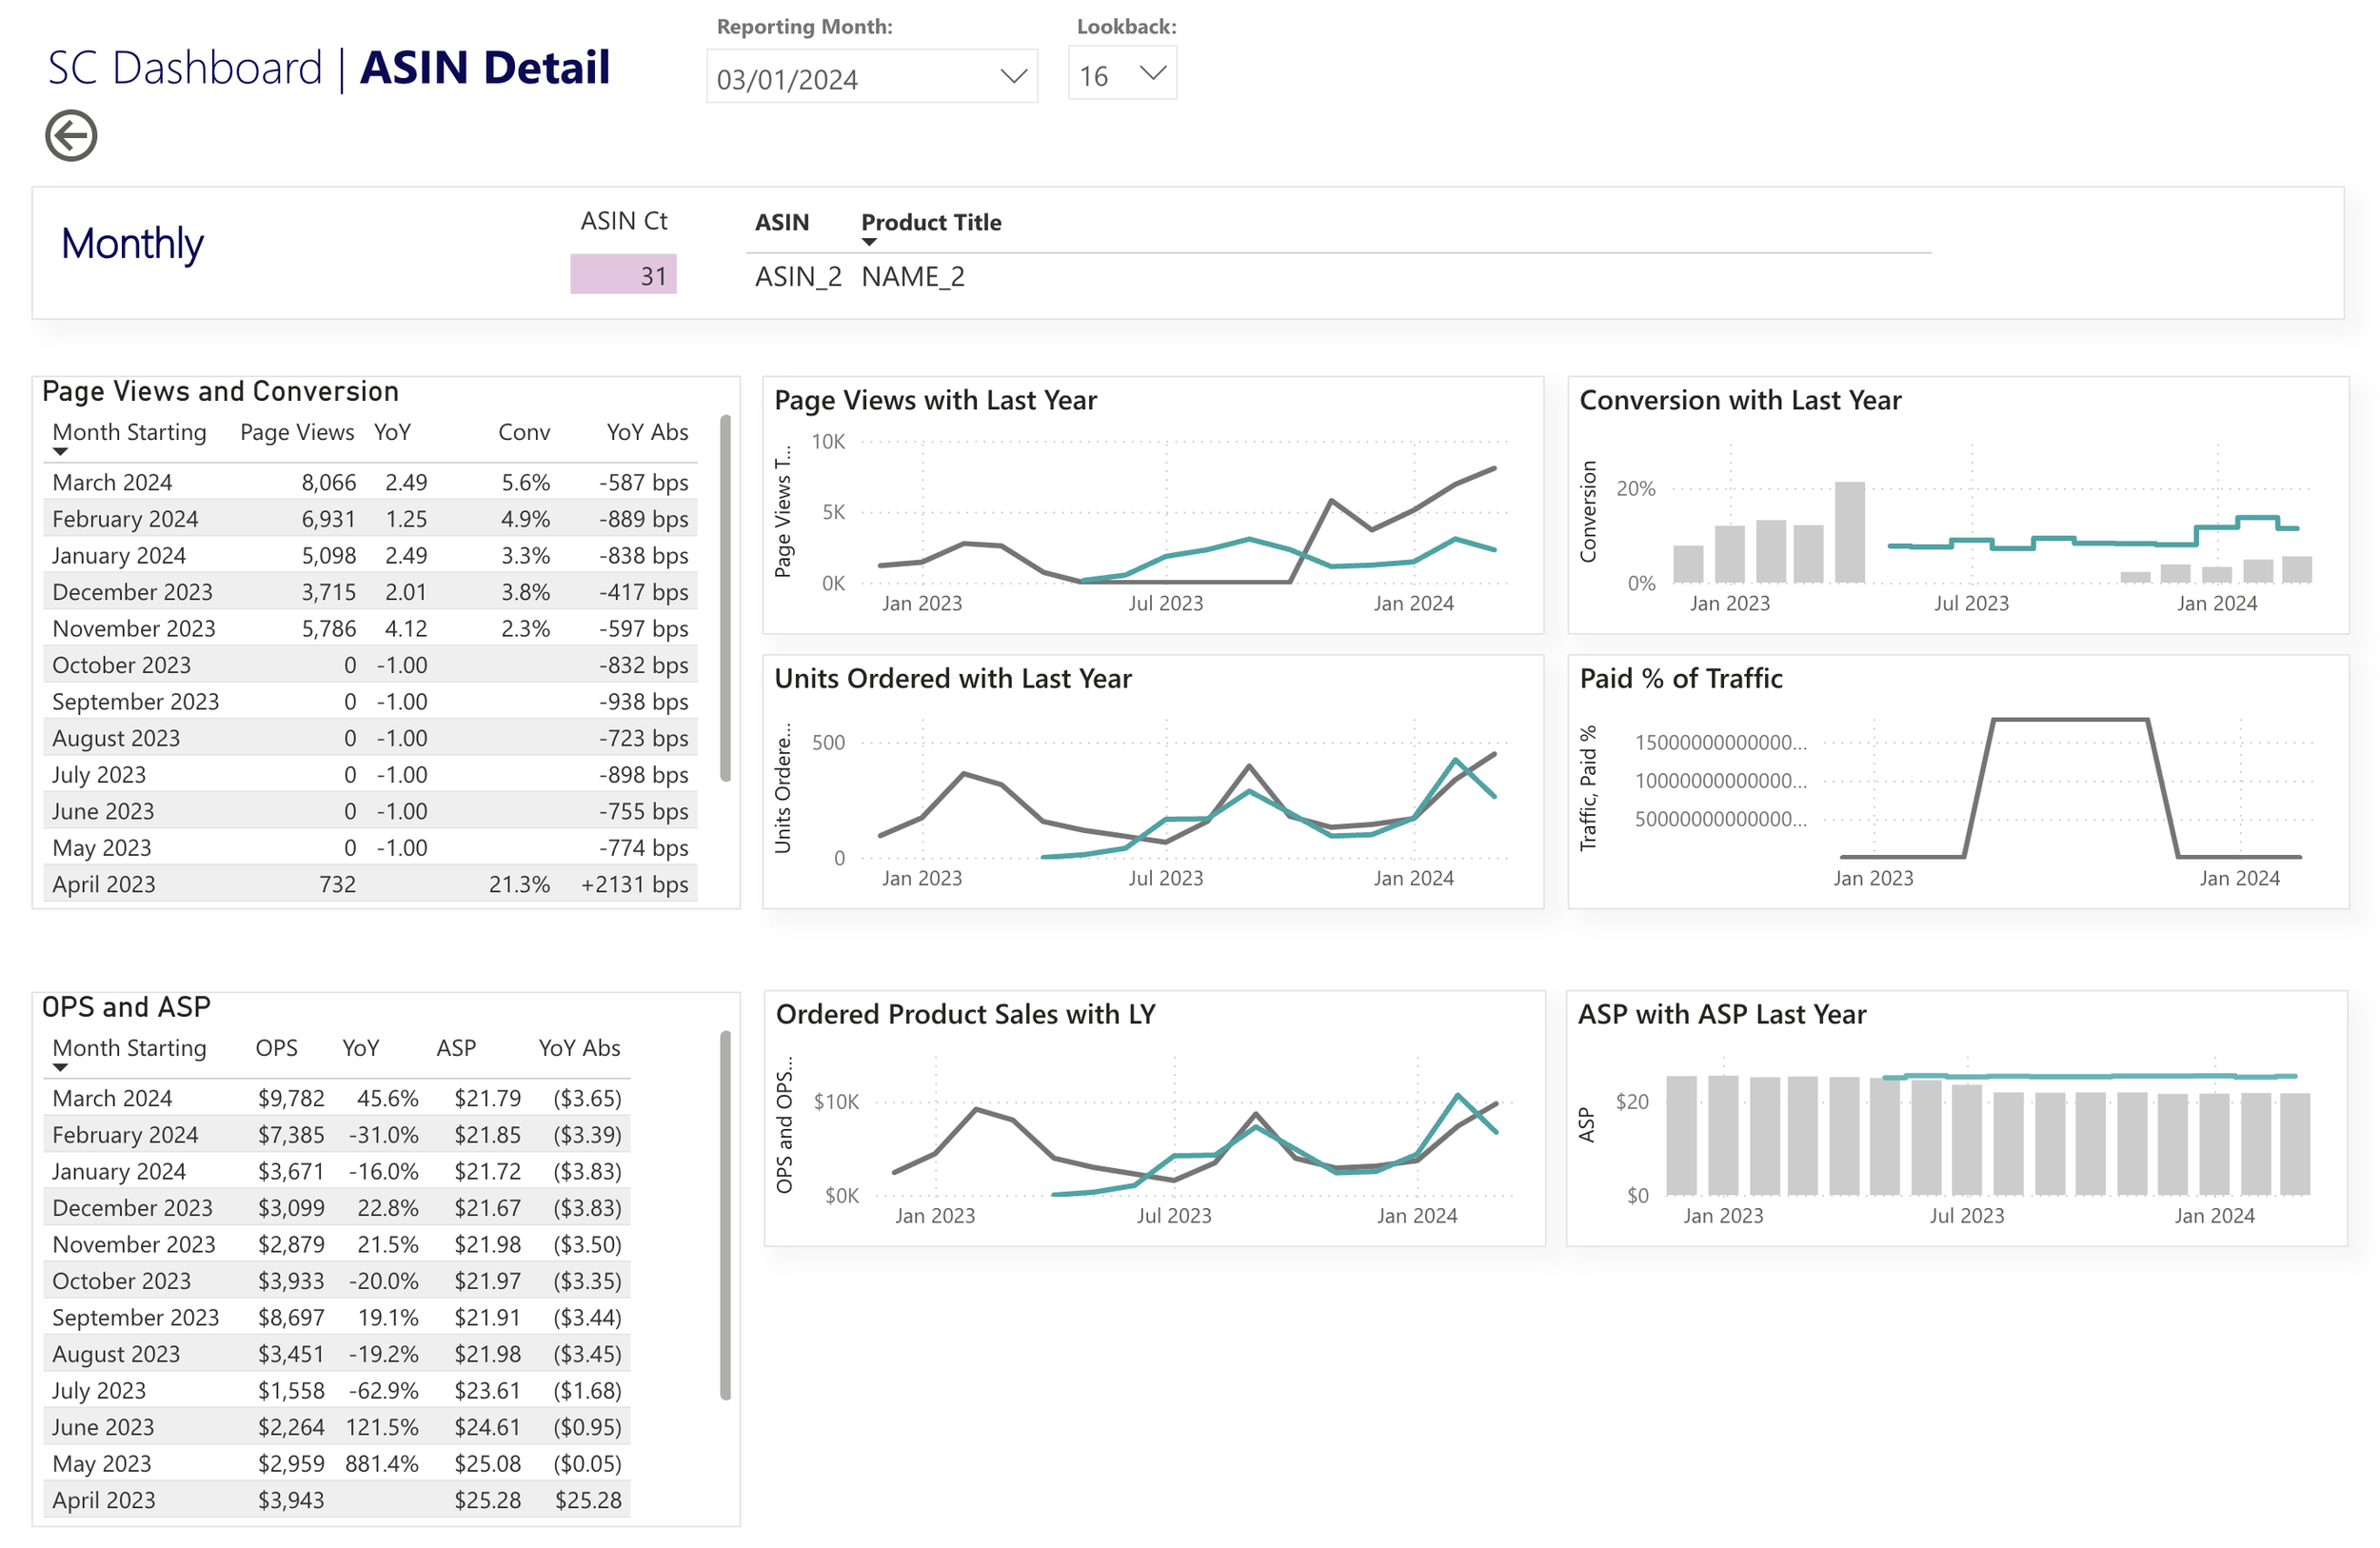
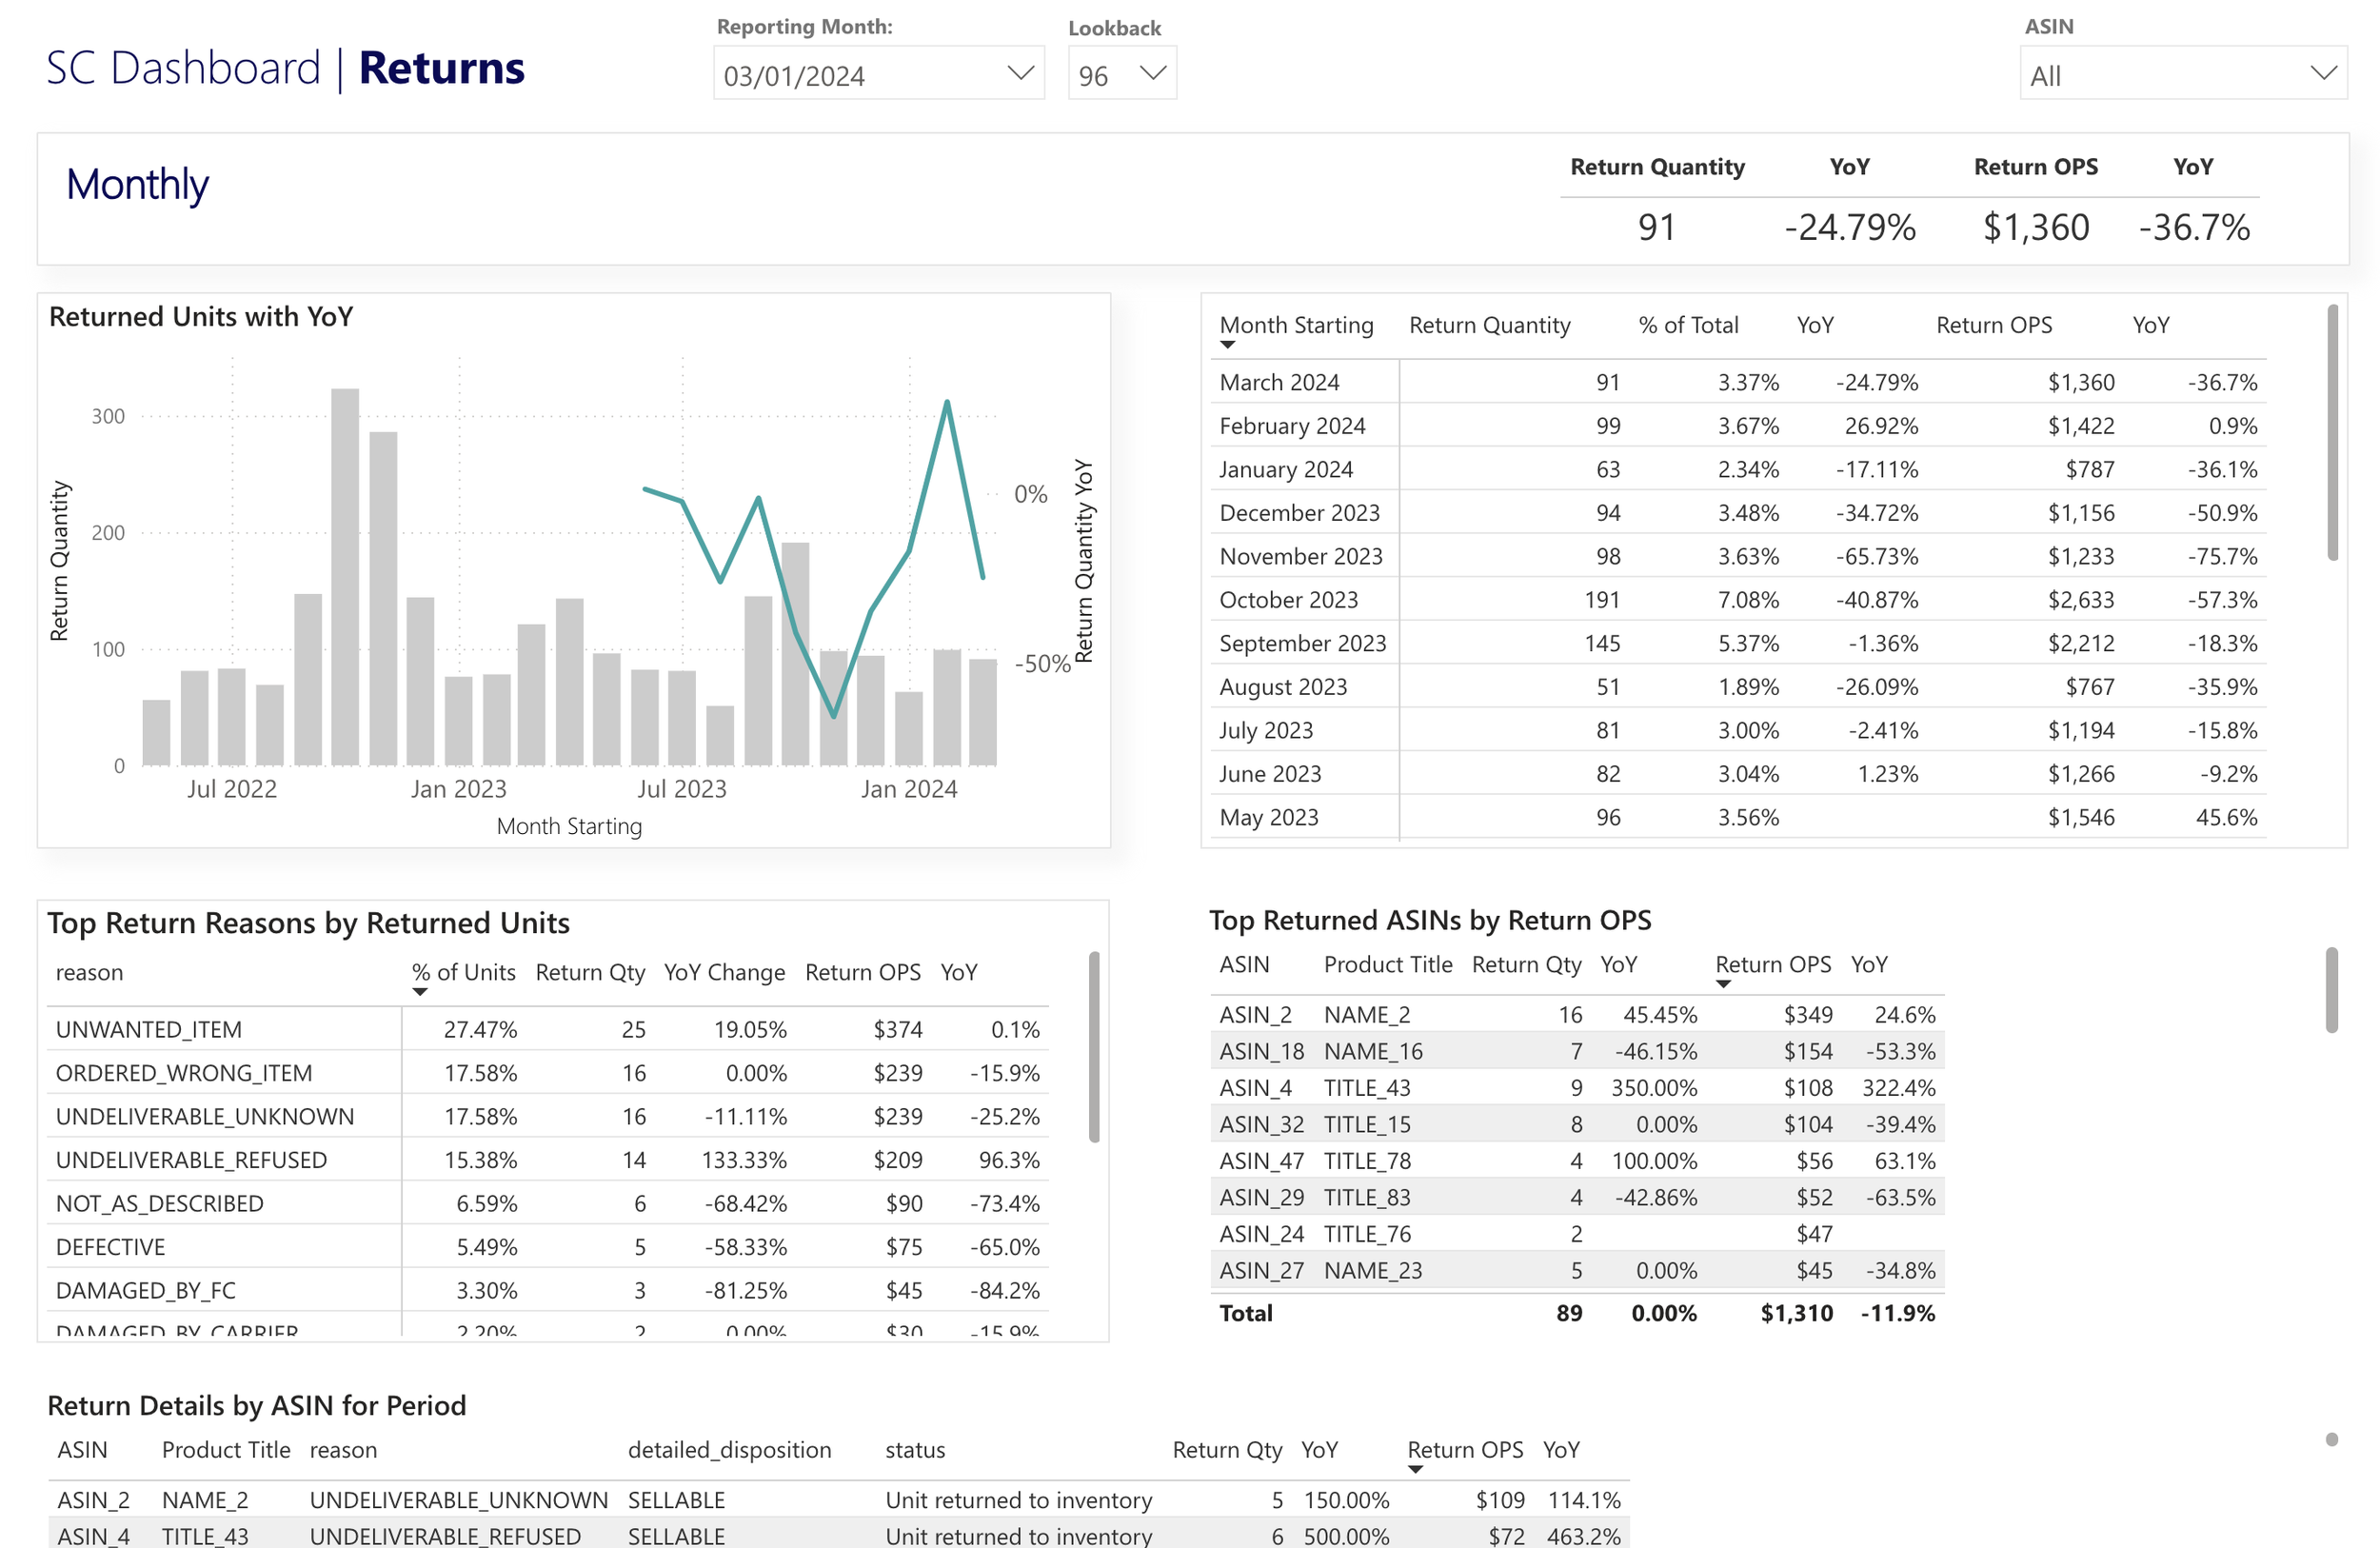
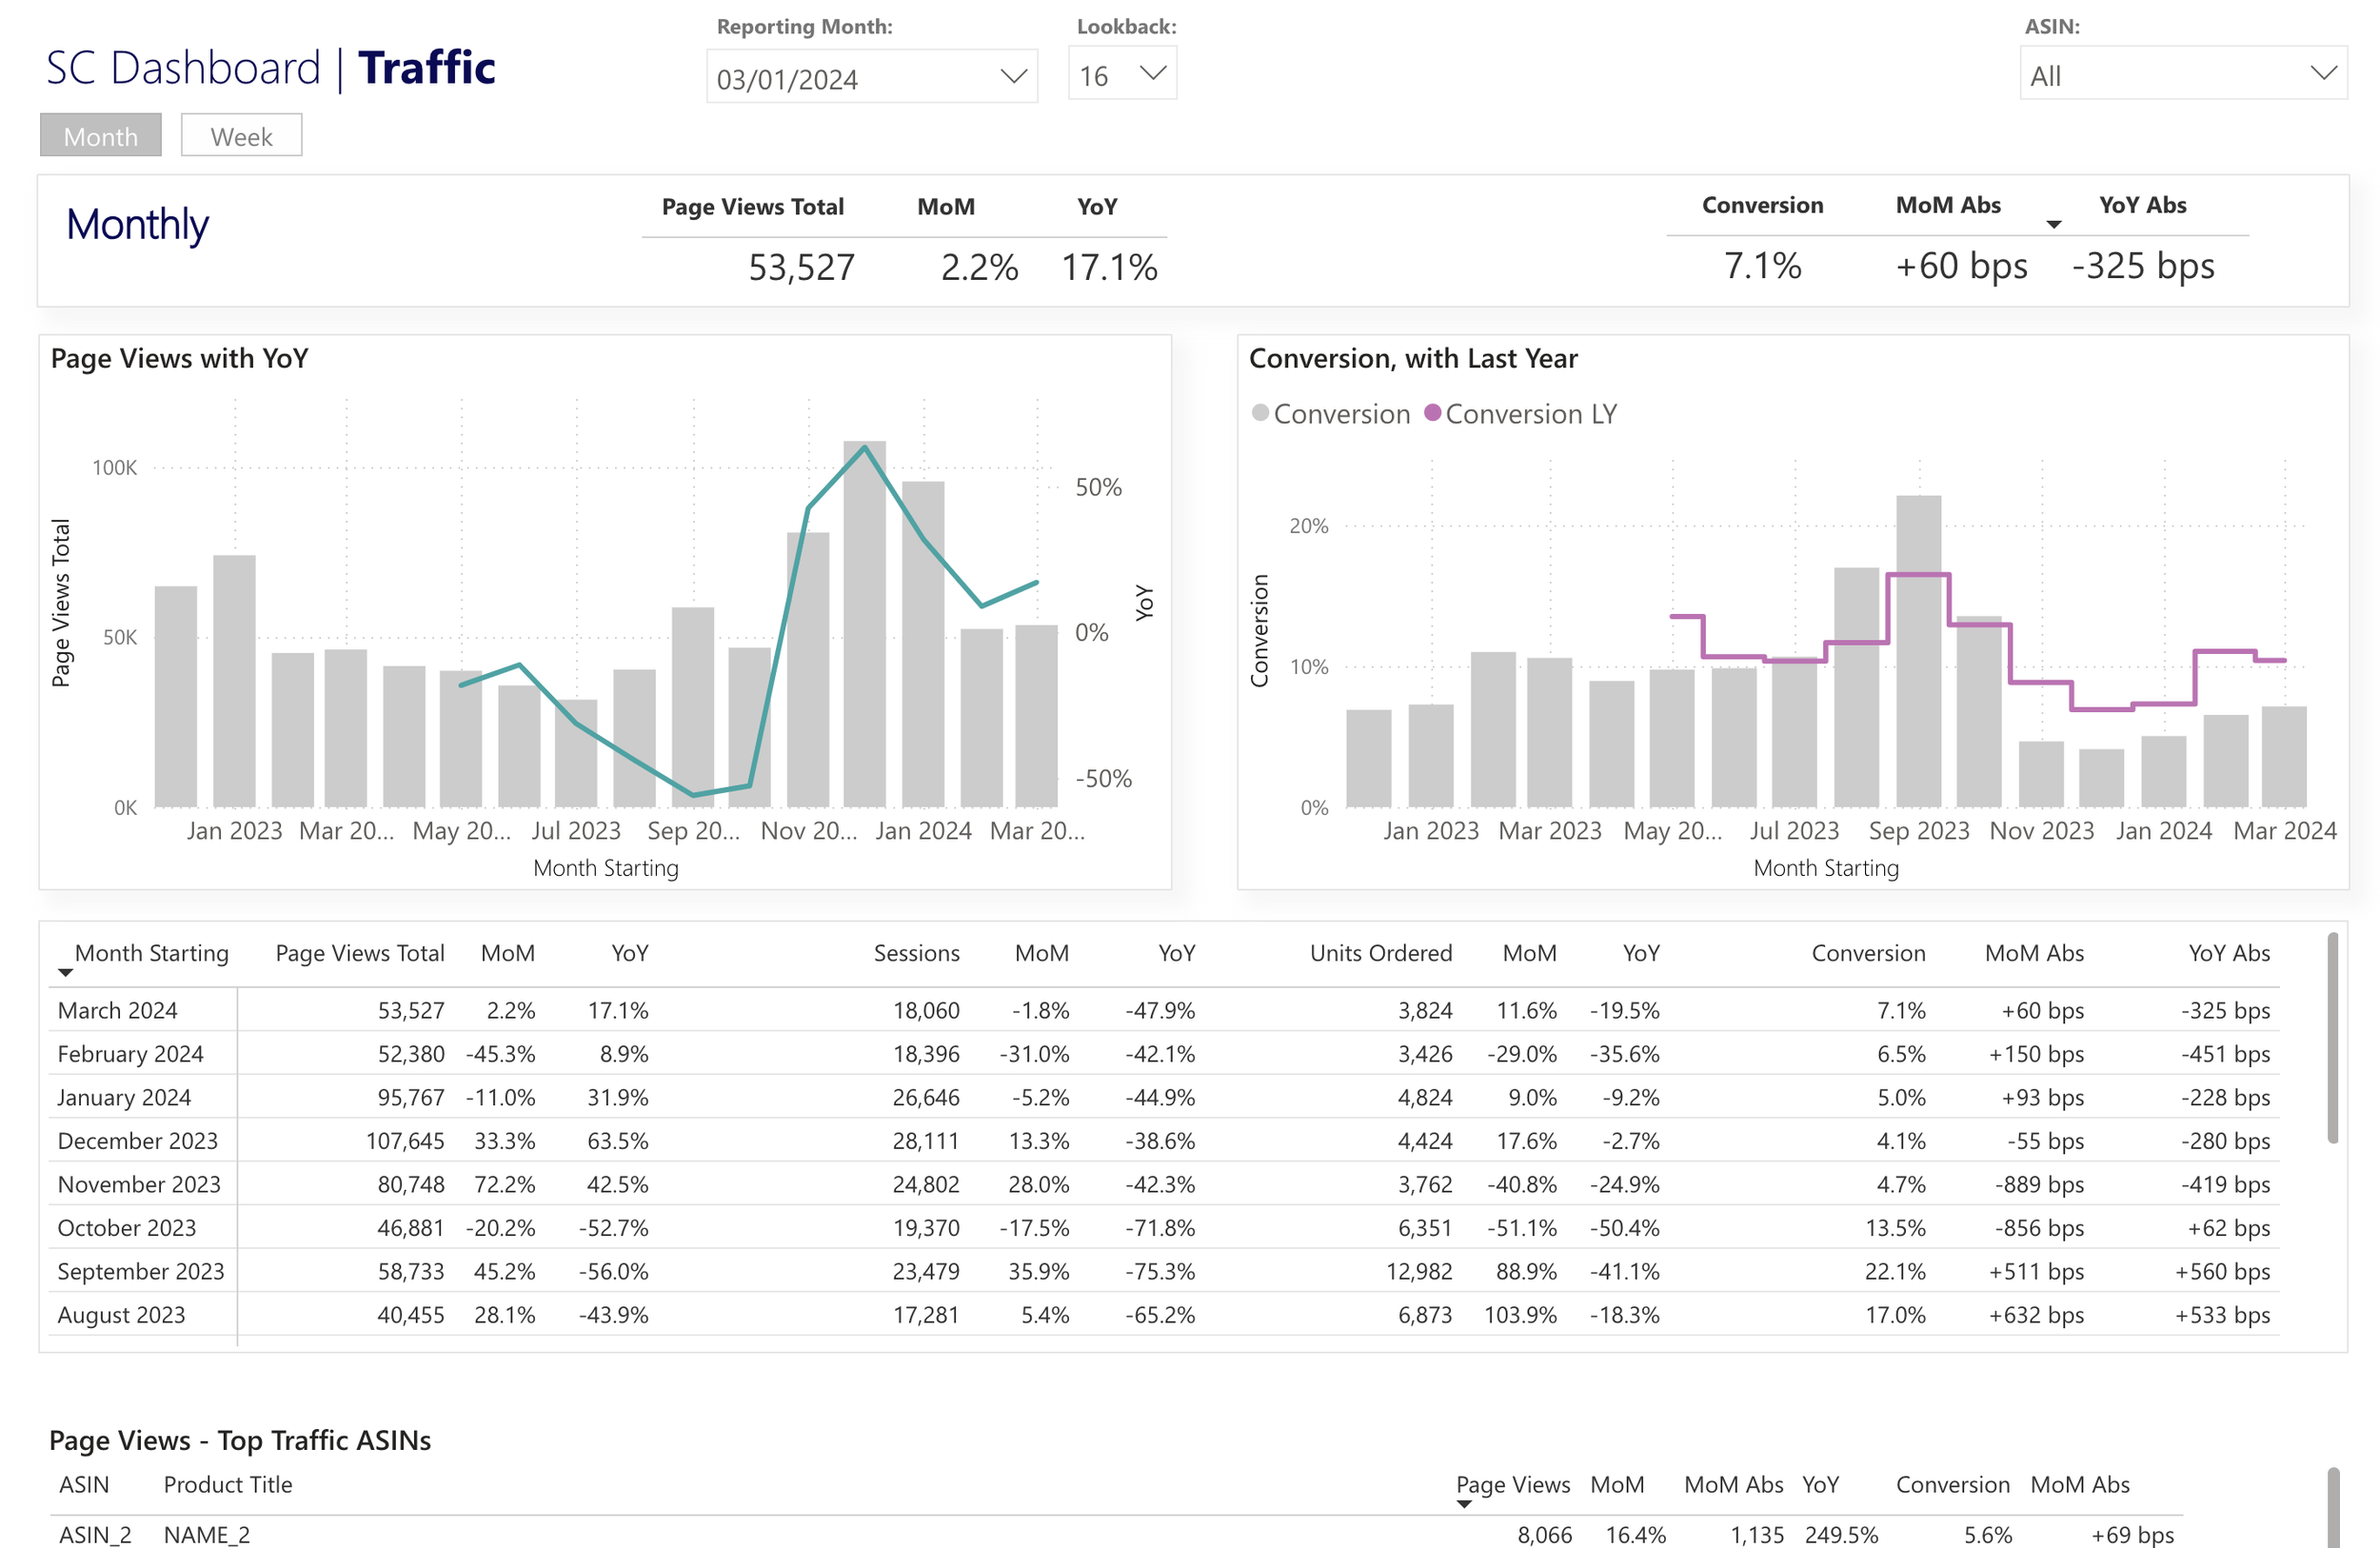
Our updated Seller Central Power BI templates help you get started with visualizing your data collected from Amazon Seller Central reporting. Instead of replicating the Seller Central UI, our templates bring together sales, inventory, and advertising data into a single interface. We’ve taken the first steps to help you visualize complex concepts such as:
Weeks of inventory cover, calculated at the ASIN level from recent demand
Inventory levels over time, by age and ASIN
Weekly and yearly growth, at any granularity and for any time period in your database
Paid vs. organic analysis of your traffic, units, and revenue
These dashboards are available now for Reason Automation customers.
Example report screenshots
