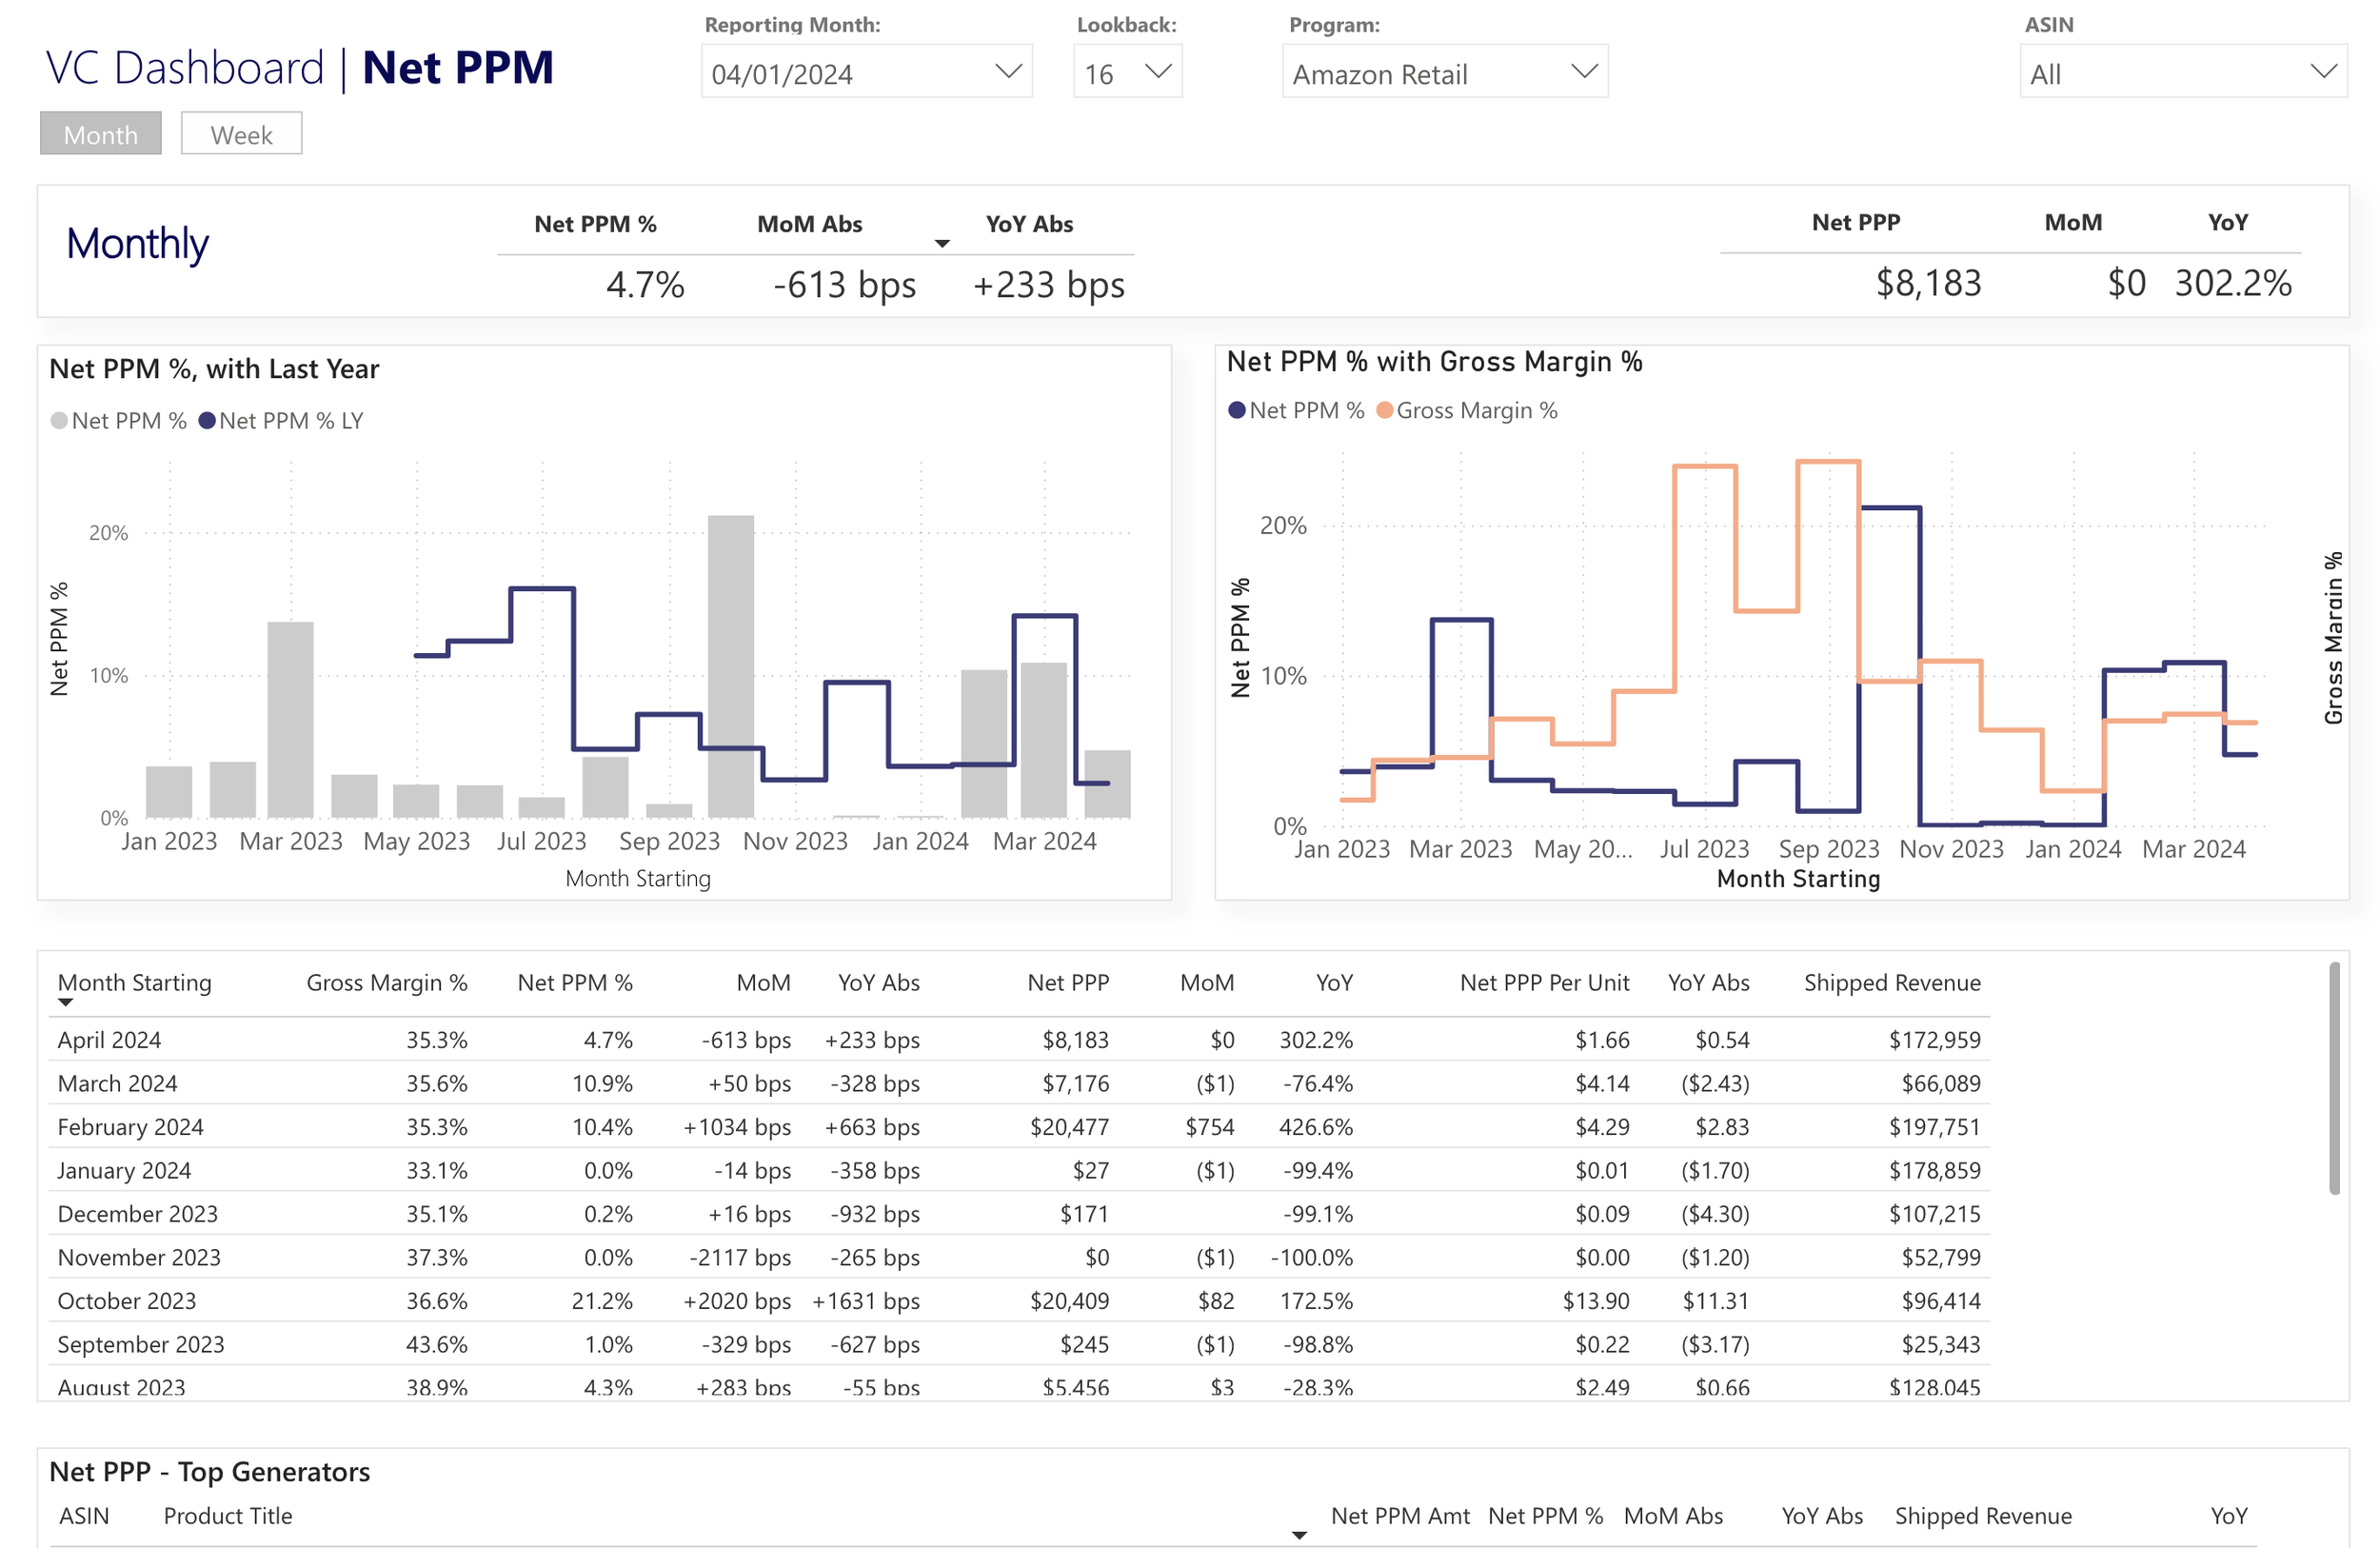
Amazon Vendor Central Power BI template for retail brands
Amazon expects brands to meet quarterly performance goals, but the Vendor Central interface makes it difficult to track performance against those goals. Order, shipment, inventory, and advertising data live in separate reports, making rigorous analysis slow and complex.
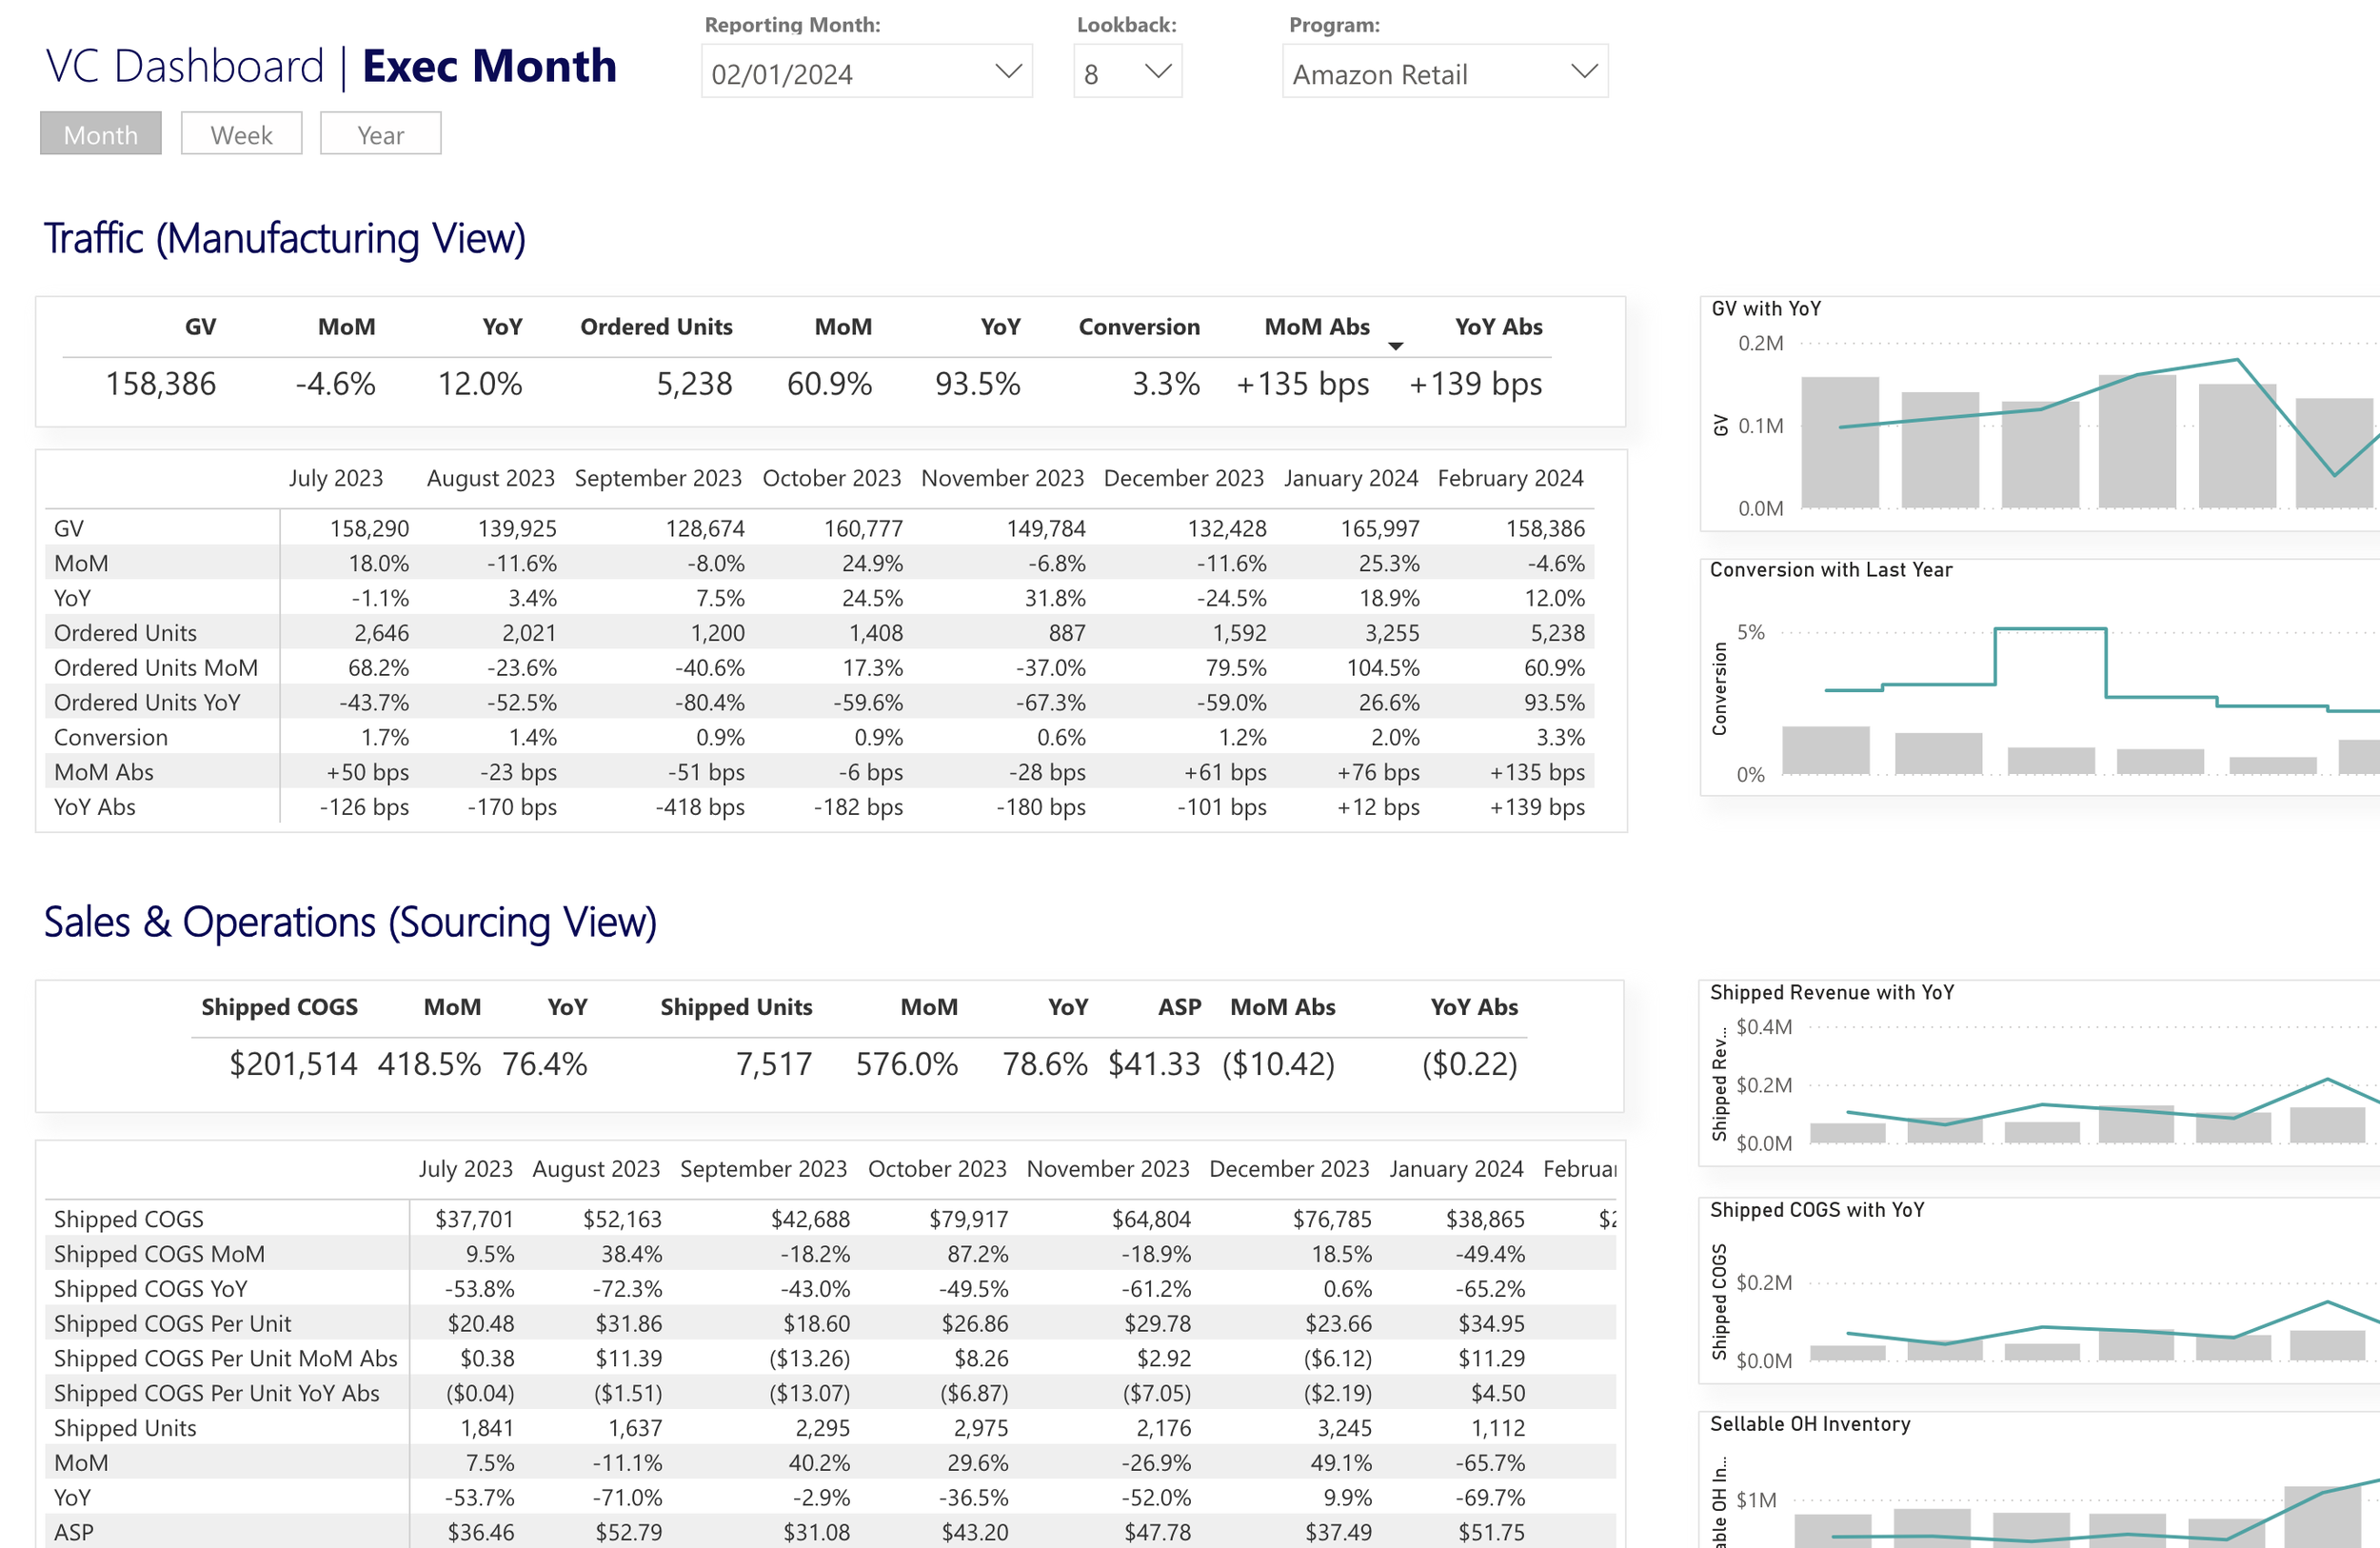
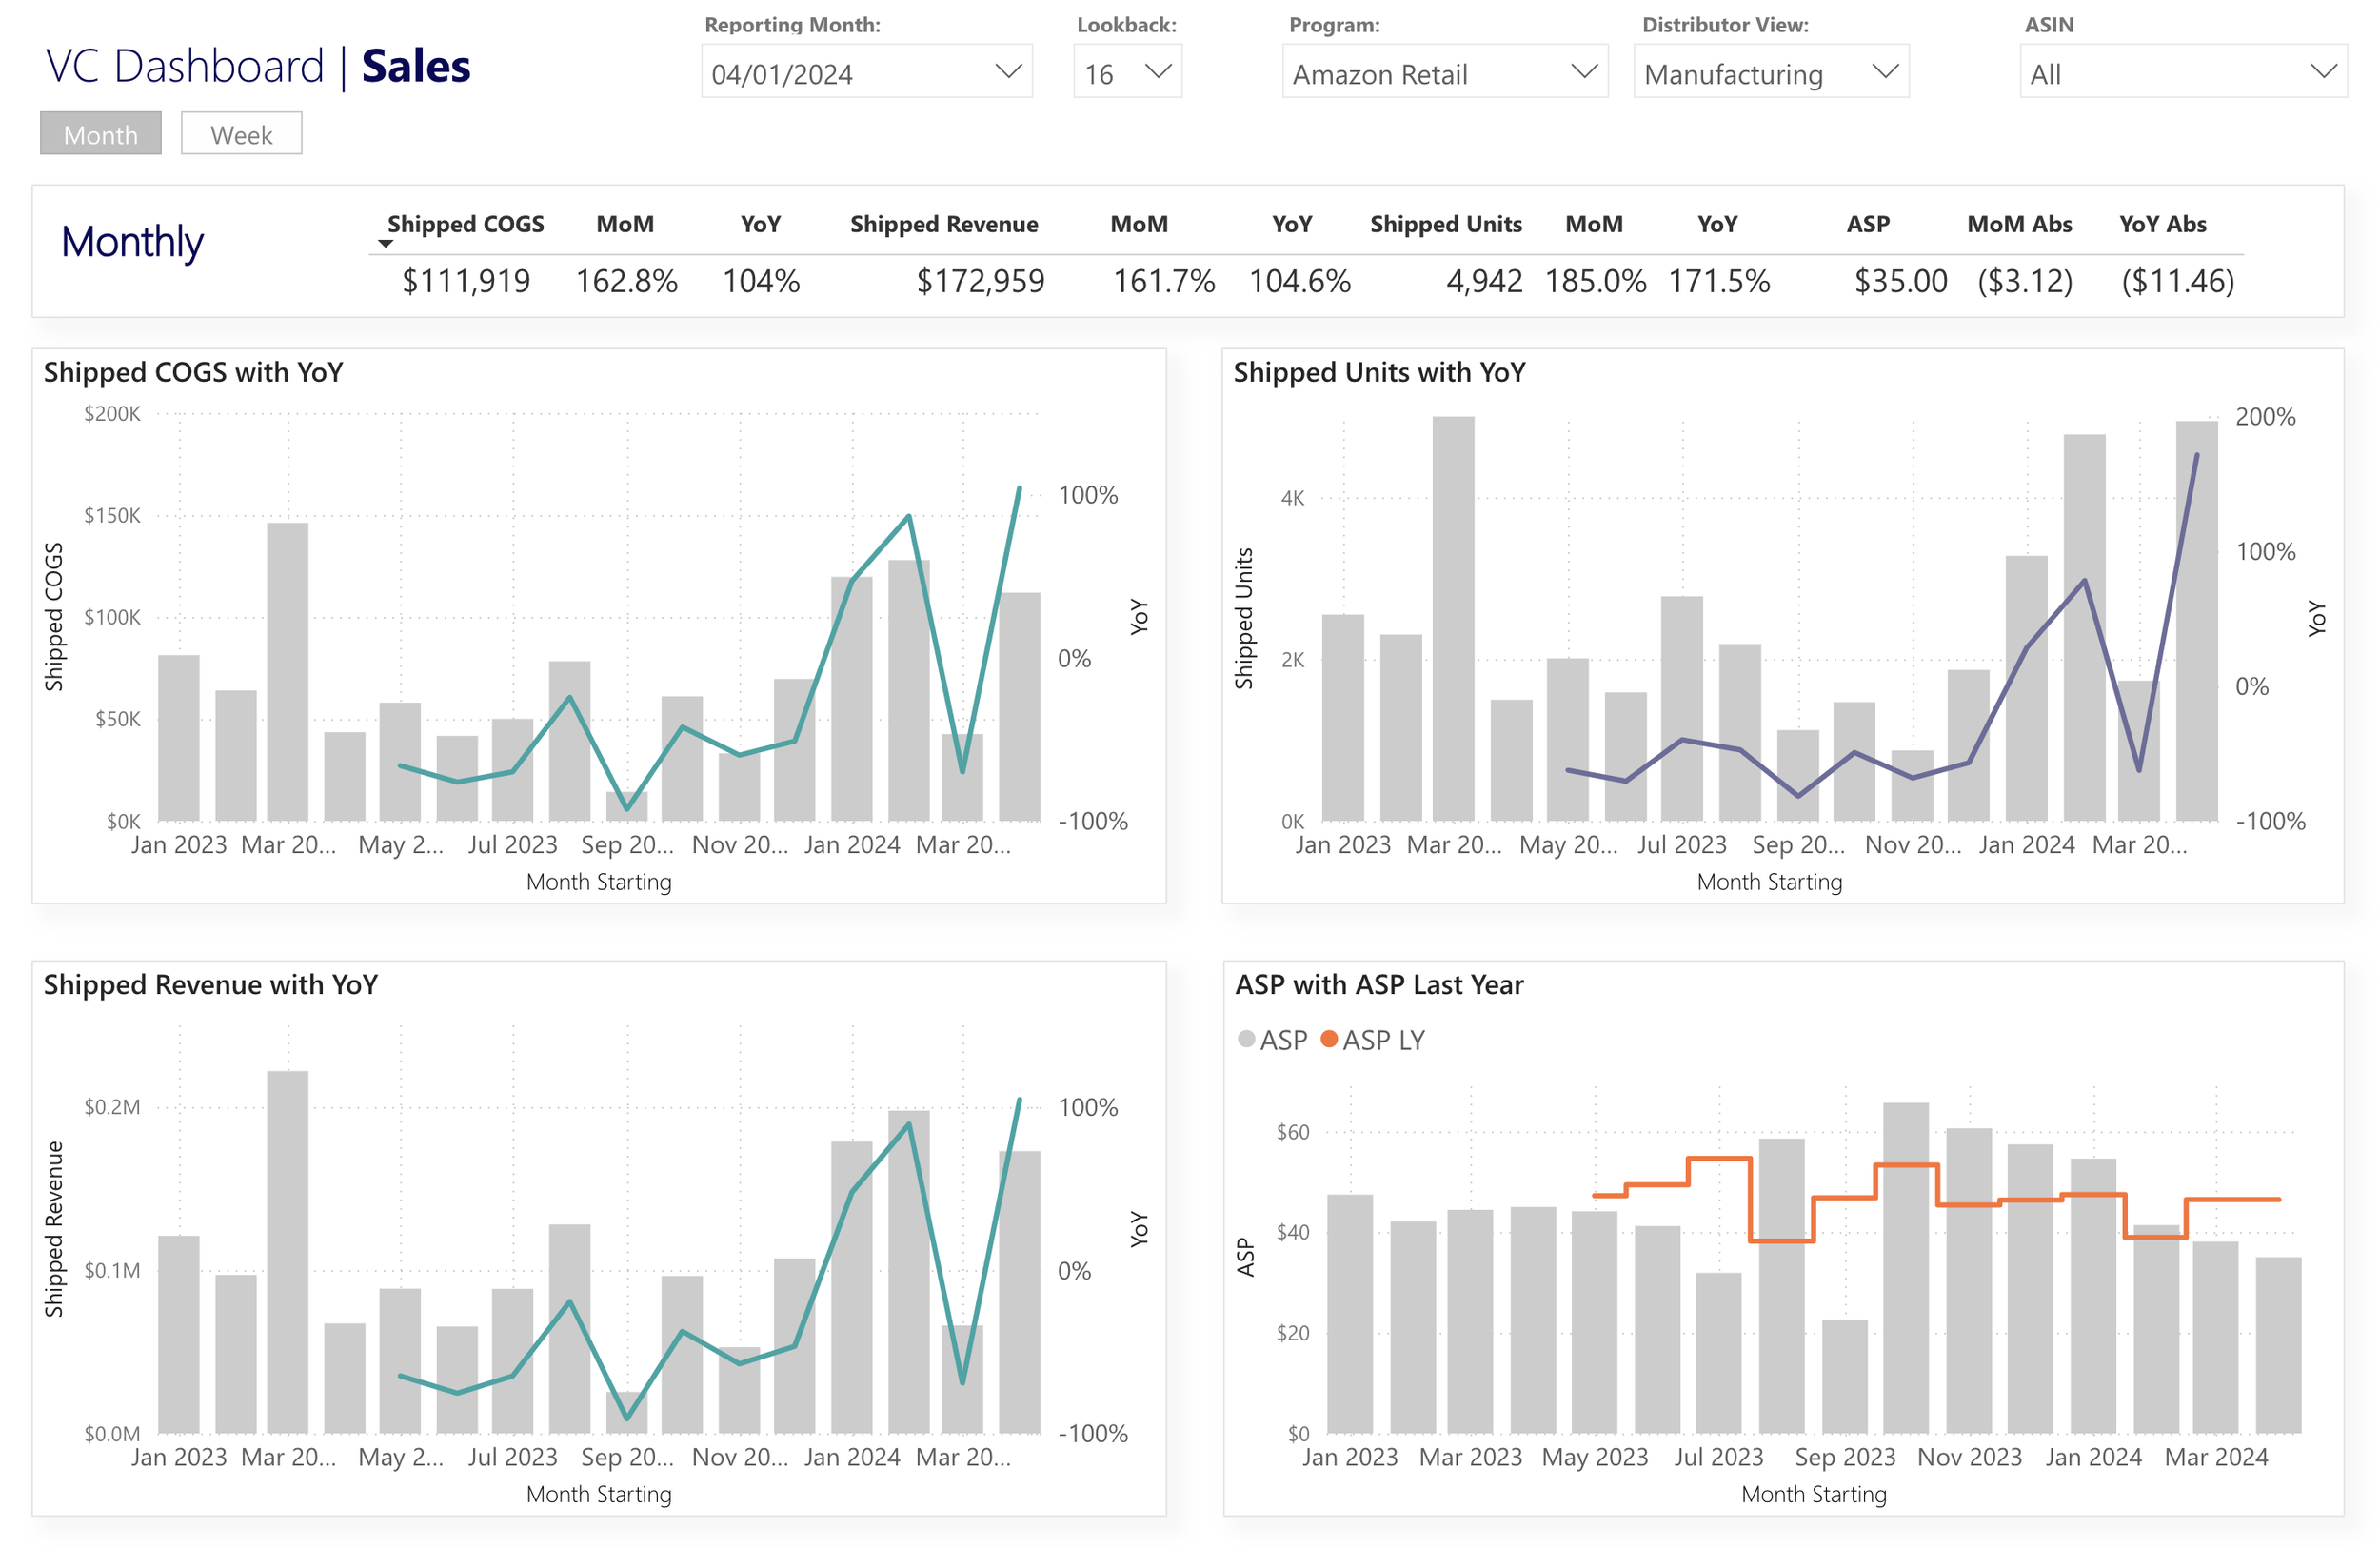
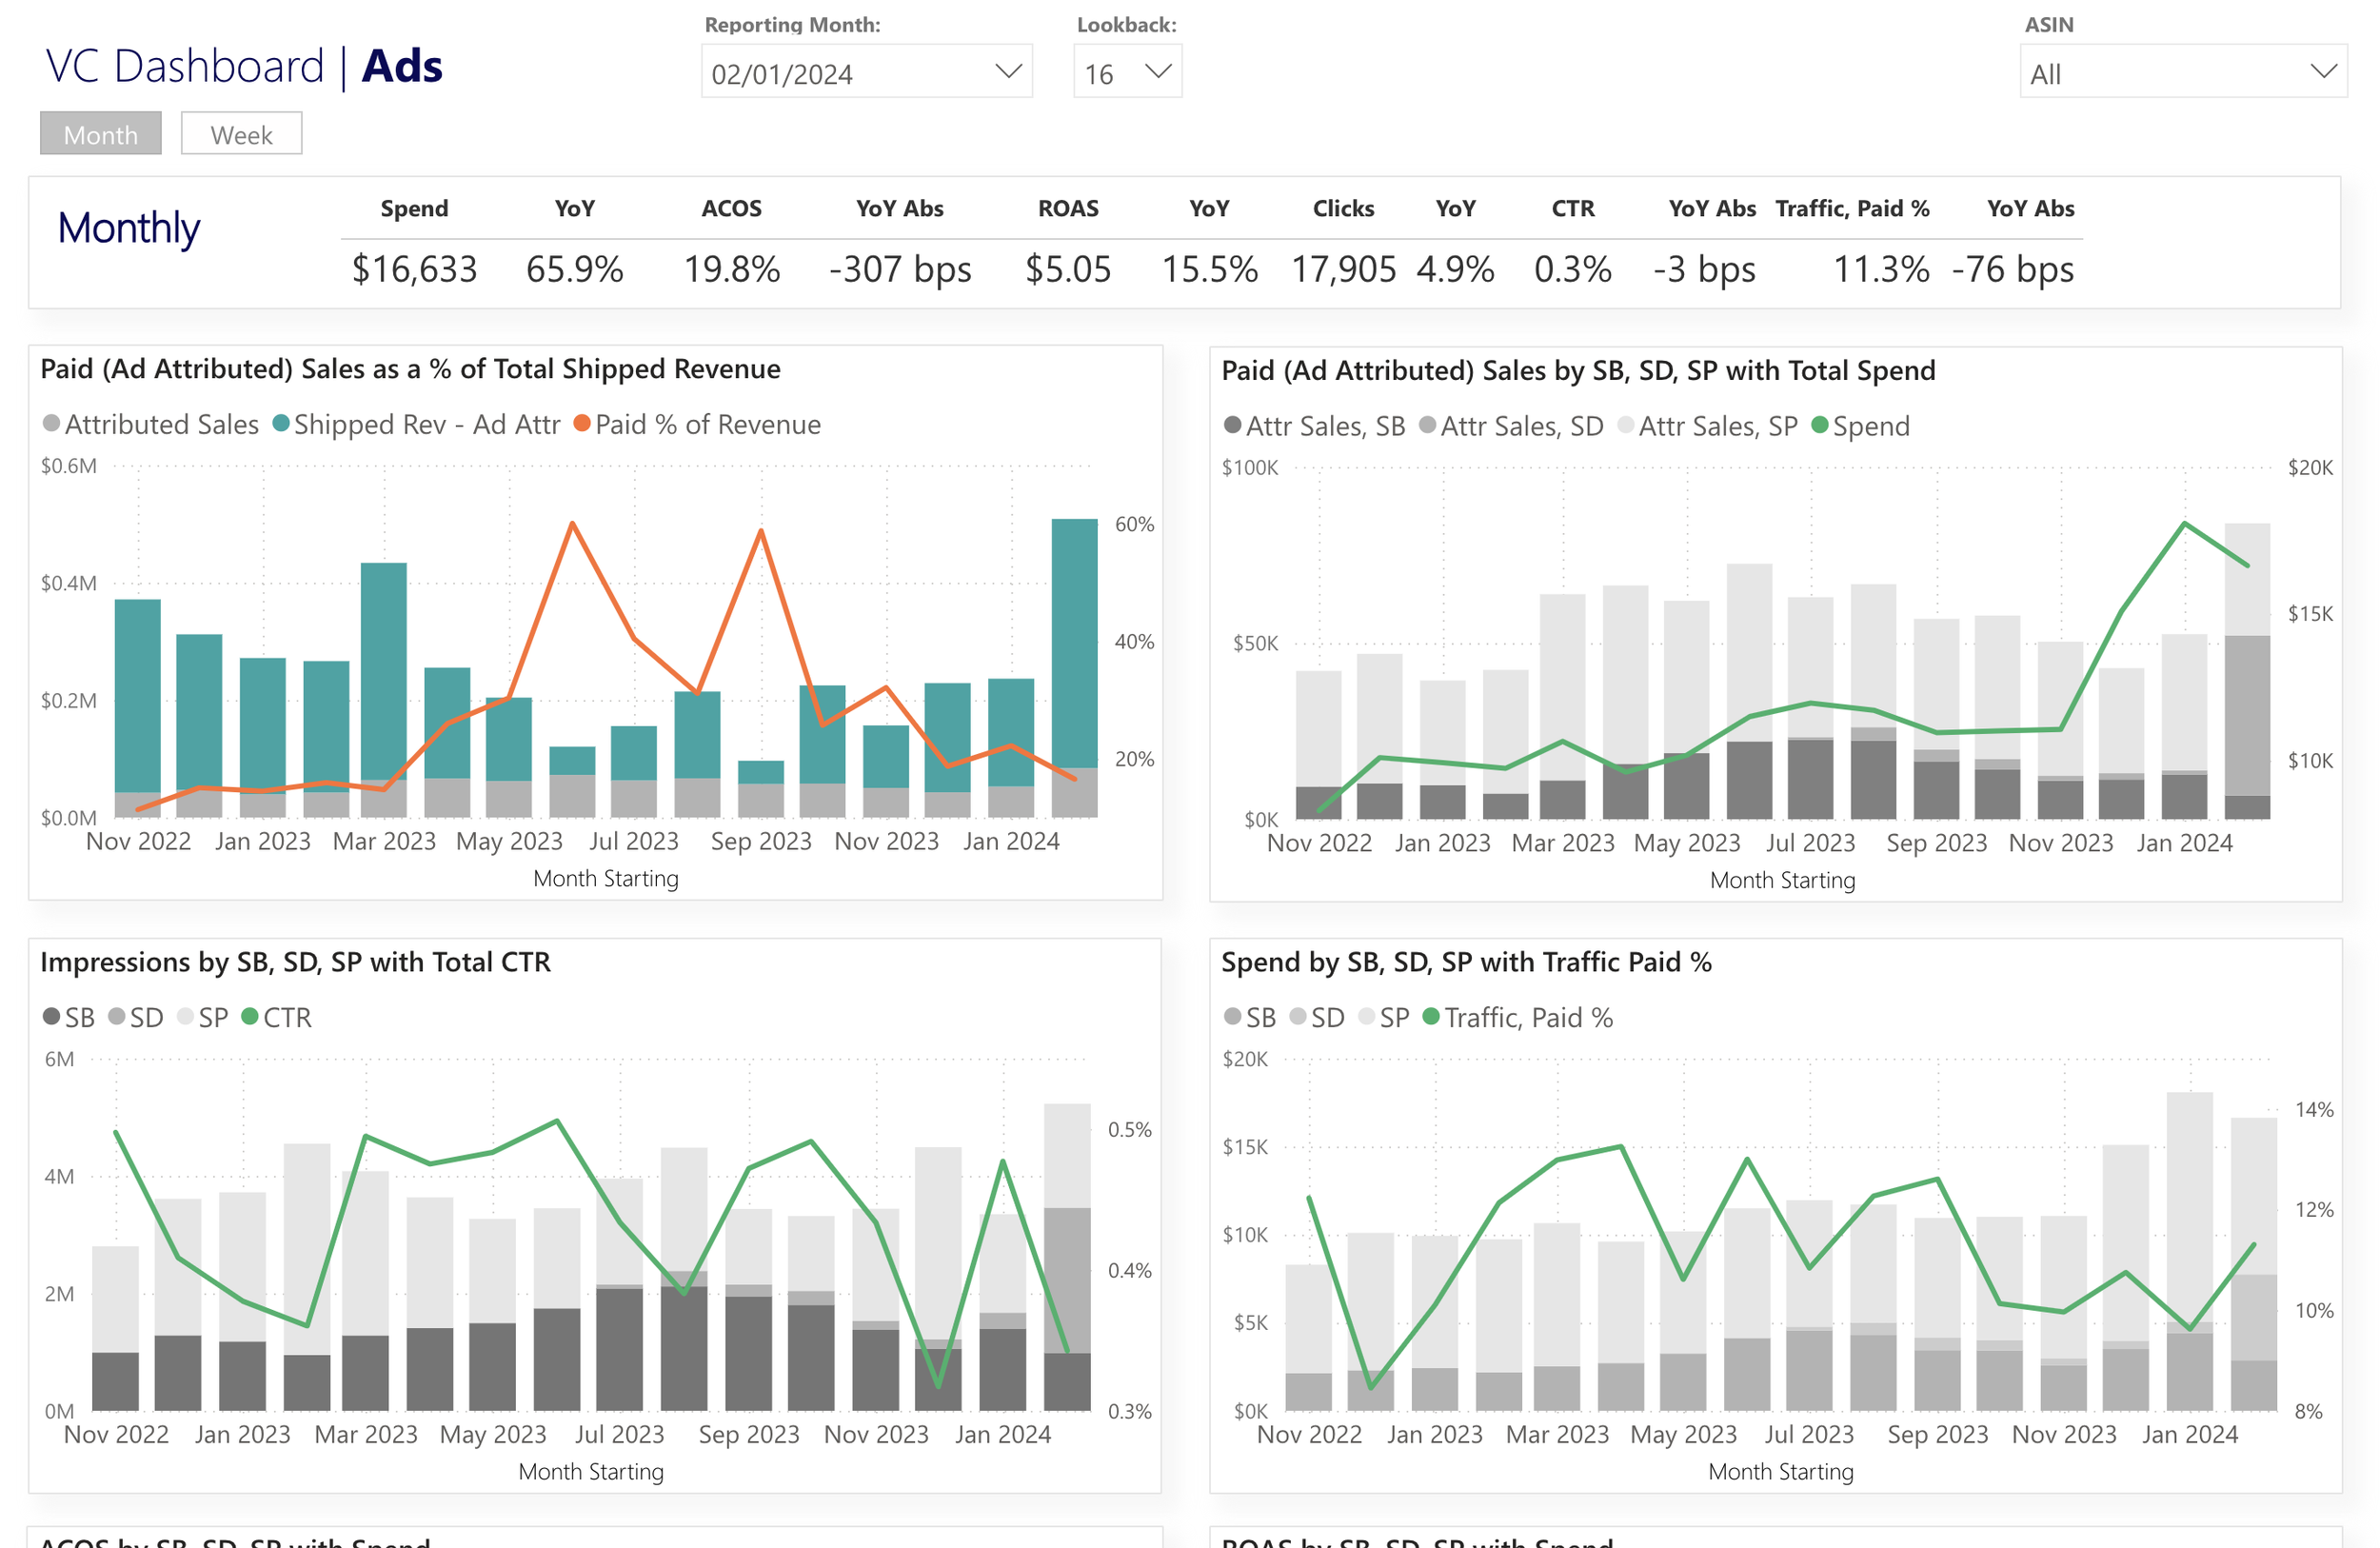
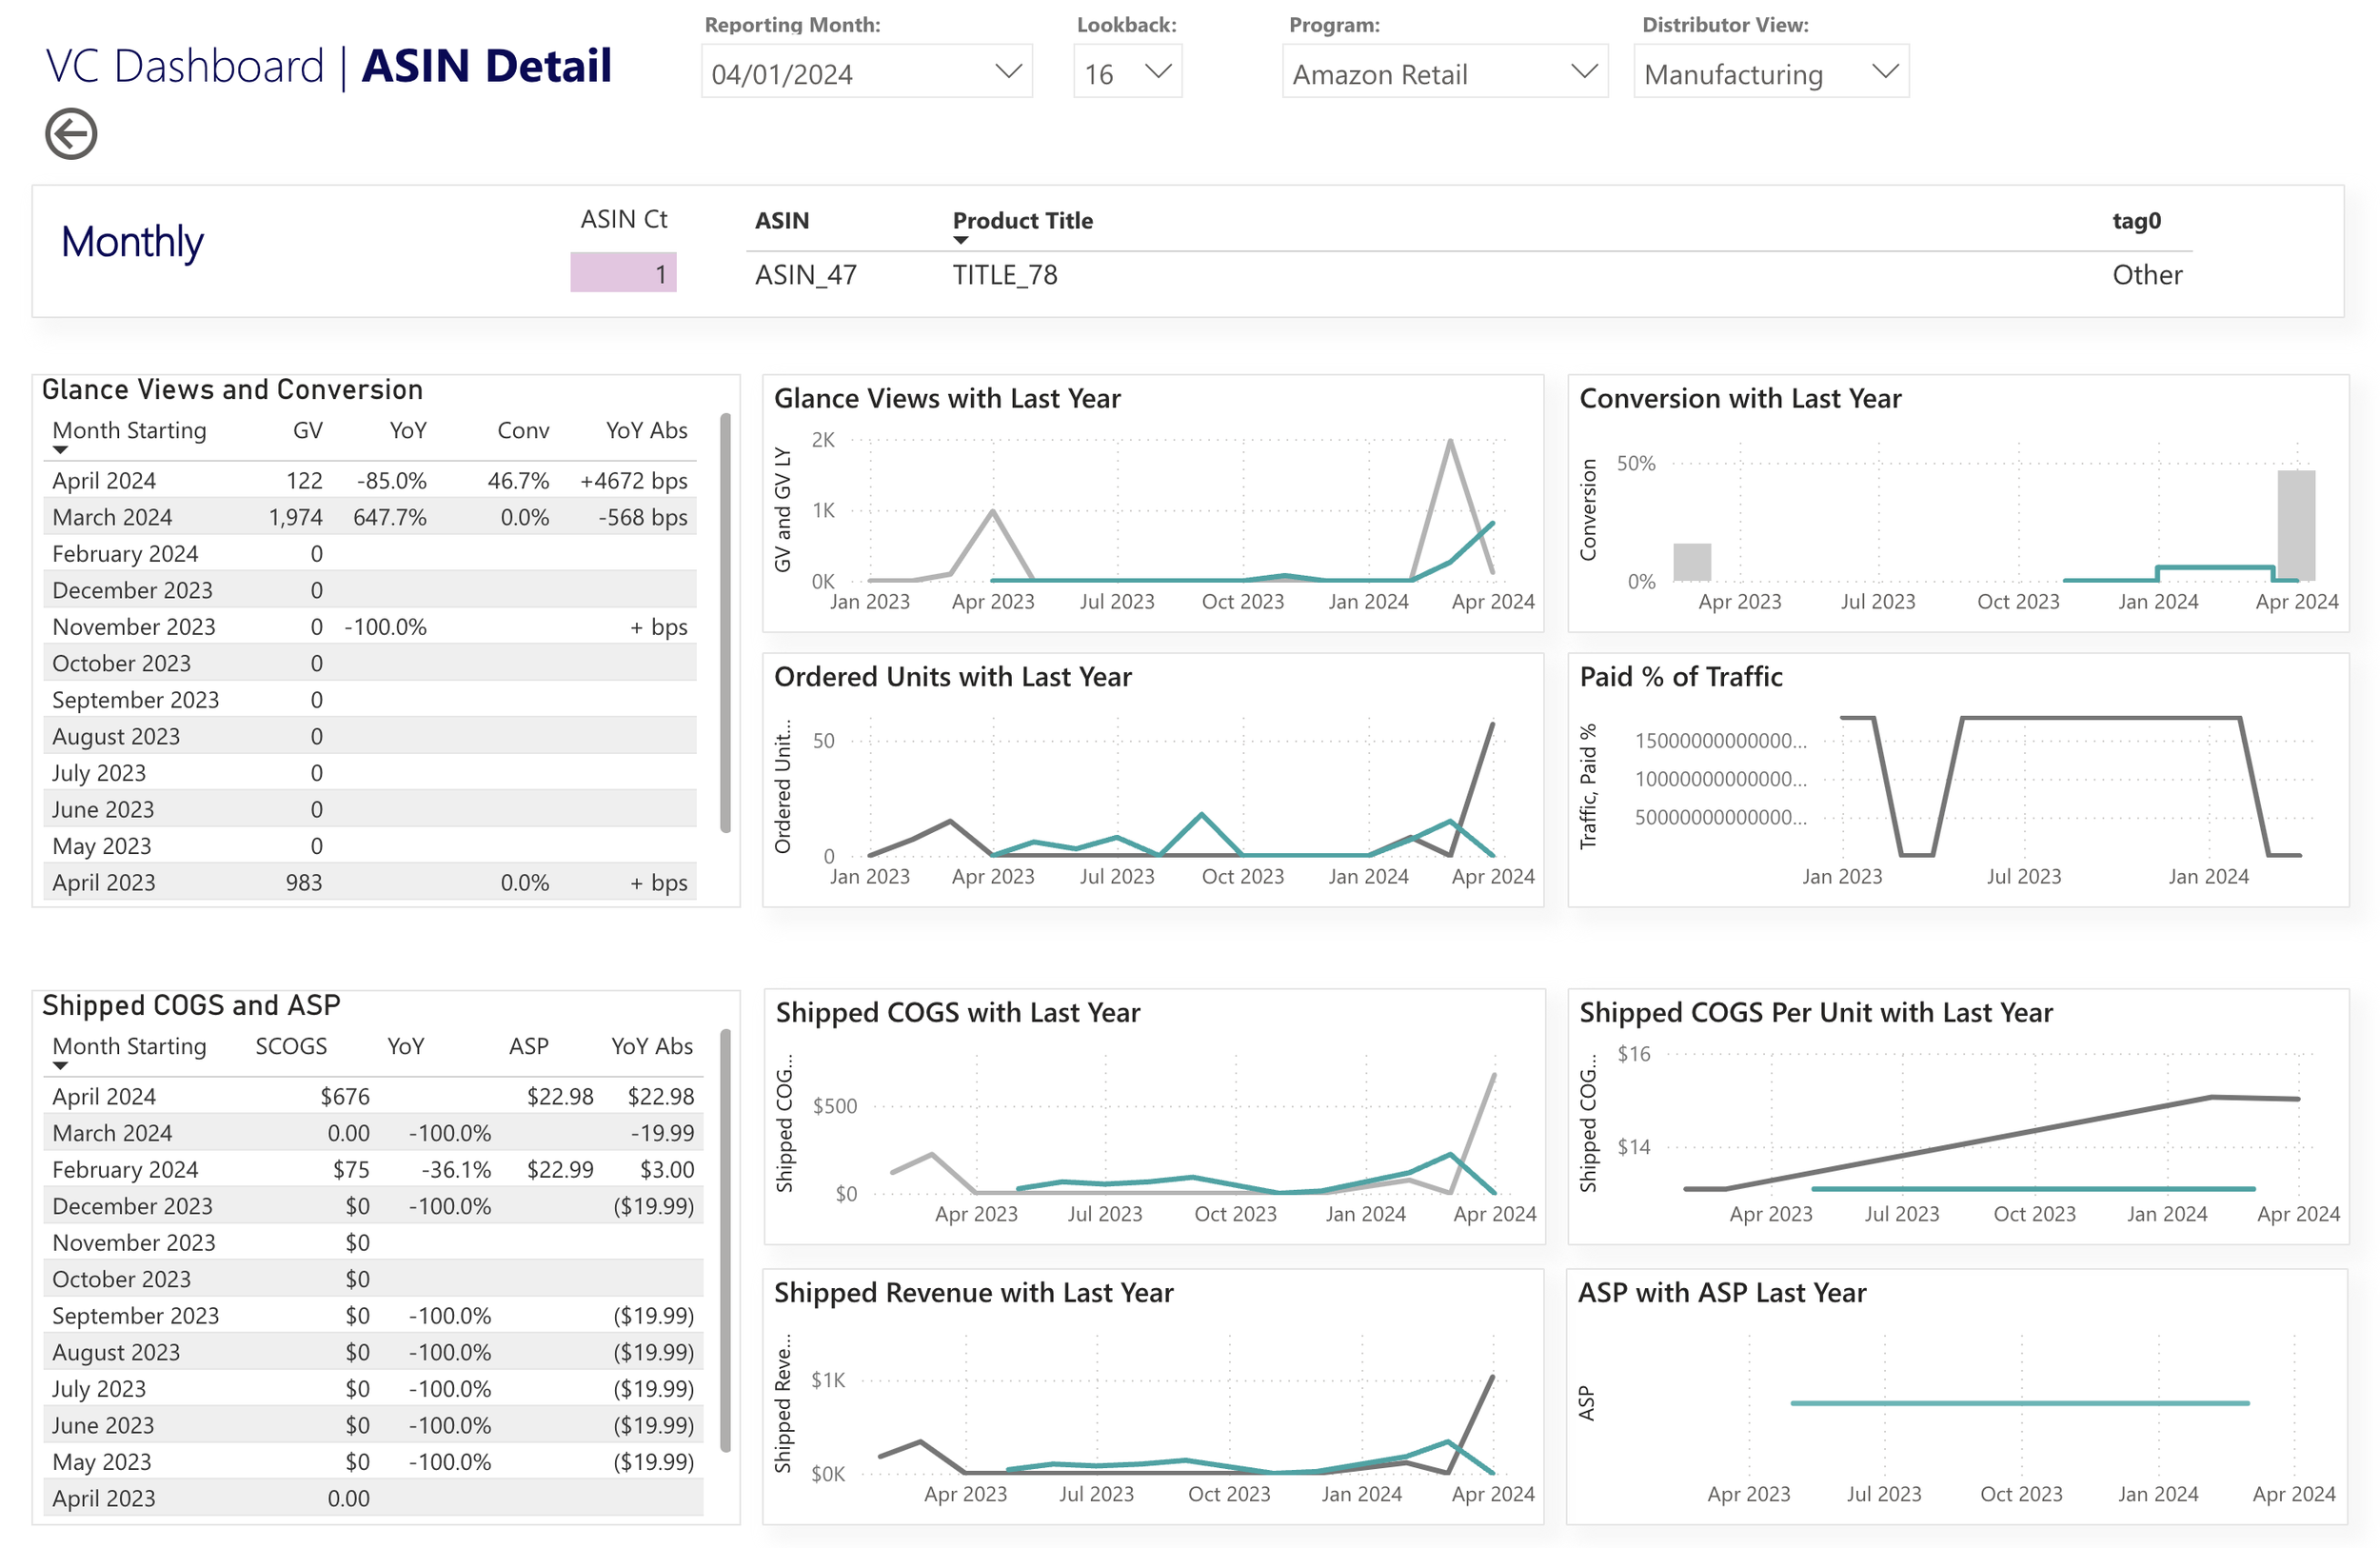
Our new Vendor Central Power BI templates address these problems to give our customers unprecedented insight into the performance of their products on Amazon.com. Vendor Central helps you understand whether a metric has changed; our reports help you understand why. We’ve taken the first steps to help you visualize complex concepts such as:
Performance by Amazon program—Retail, Amazon Fresh, Amazon Business, etc.
Inventory levels over time, by age and ASIN
Weekly and yearly growth, at any granularity and for any time period in your database
Impact of your advertising campaigns on sales performance and Amazon ordering
Total performance across manufacturing and sourcing views
These dashboards are available now for Reason Automation customers.
Example report screenshots
