
The Net PPM Formula & Why Amazon Vendors Must Track This Metric

As an Amazon vendor, profitability is central to your business strategy—not only in terms of your own margins but also Amazon’s perception of your product profitability. One of the key metrics Amazon uses to measure this is Net PPM (Net Pure Profit Margin). Understanding and optimizing Net PPM is essential for maintaining a strong vendor relationship, negotiating favorable terms, and ultimately increasing your profitability on Amazon.
This guide will break down the details of Net PPM, explain its significance, and provide strategies for analyzing and using this metric to prioritize opportunities.
Table of Contents:
What is Amazon Net PPM?
Net PPM, or Net Pure Profit Margin, is Amazon's gross profit calculation for a product after factoring in the cost of goods sold (COGS), vendor terms (like co-op and accrual agreements), and sales discounts. It provides a holistic view of product profitability, helping Amazon evaluate which products are most beneficial to their bottom line.
In practice, the Net PPM value is the percentage profit Amazon makes on a product after all these factors are considered. For vendors, a higher Net PPM means that Amazon is more likely to view your products favorably and be open to negotiating better terms.
$$ \text{Net PPM} \;=\; \frac{\text{Shipped Revenue} - \text{Shipped COGS} + \text{ContraCOGS} - \text{Sales Discount}} {\text{Shipped Revenue}} $$
Shipped Revenue: The total revenue for Amazon generated from the sale of the product. Amazon calculates net PPM using shipped revenue, not ordered revenue.
Shipped COGS: The item’s PO cost price; the cost of goods sold that Amazon paid the vendor for the product.
ContraCOGS (Contra-Cost of Goods Sold): Vendor-provided terms like co-op agreements, accruals, and promotional investments that offset the cost of the product for Amazon. Typically billed when products are received as a percentage of net receipts, but also includes any price promotion funding.
Sales Discounts: Discounts provided to customers that are not reflected in the selling price (i.e. not instant rebates).
Why is Net PPM Important for Amazon Vendors?
Net PPM plays a critical role in your negotiations with Amazon. It is one of the primary metrics Amazon Vendor Managers use during quarterly or annual reviews to assess product profitability and determine vendor terms. If your Net PPM is healthy, Amazon is more likely to offer favorable trade terms, while a low Net PPM may prompt Amazon to push for cost reductions or adjustments to your terms.
Additionally, tracking Net PPM helps you understand how your products perform relative to your competitors within the same category. A strong Net PPM positions you better in category-level negotiations because your products are more profitable than your competitors’, while a low Net PPM may lead to delisting or reduced exposure for your products on Amazon's platform.
How to View and Analyze Net PPM
You can find Net PPM metrics in Amazon Vendor Central in the Reports: Retail Analytics section. Amazon has a dedicated Net PPM report that shows PPM% by product. However, as of January 2026 the best place to get your Net PPM data is from the Sales report, because of a bug in the Vendor Central interface. By using the Sales report in Sourcing view, you can go beyond Net PPM percentage by product, and add optional columns for the entire PPM formula:
Shipped revenue
Shipped units
Shipped COGS
Contra-COGS (your vendor terms)
Sales discount
Step 1
Open the Sales report in Vendor Central and choose the Sourcing distributor view.
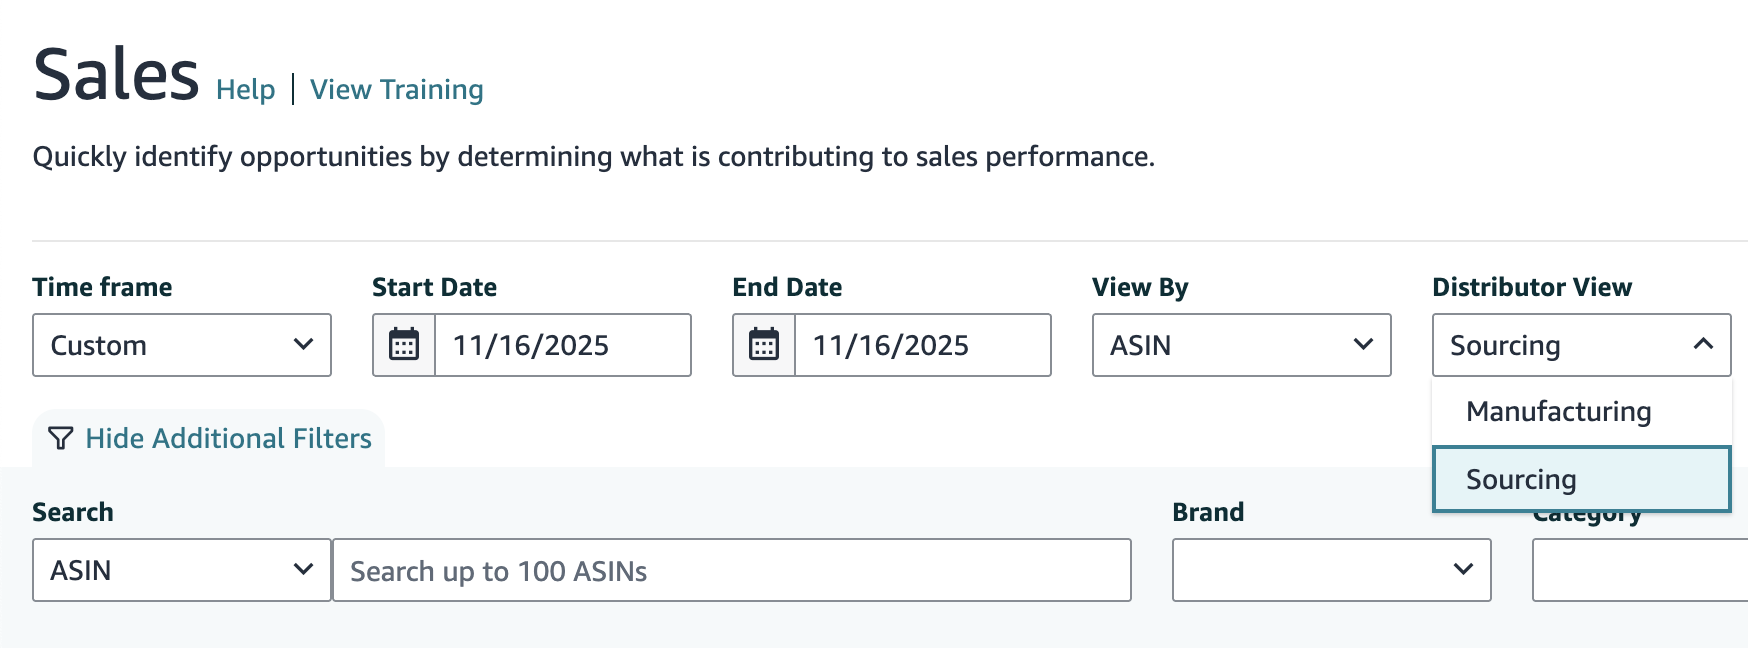
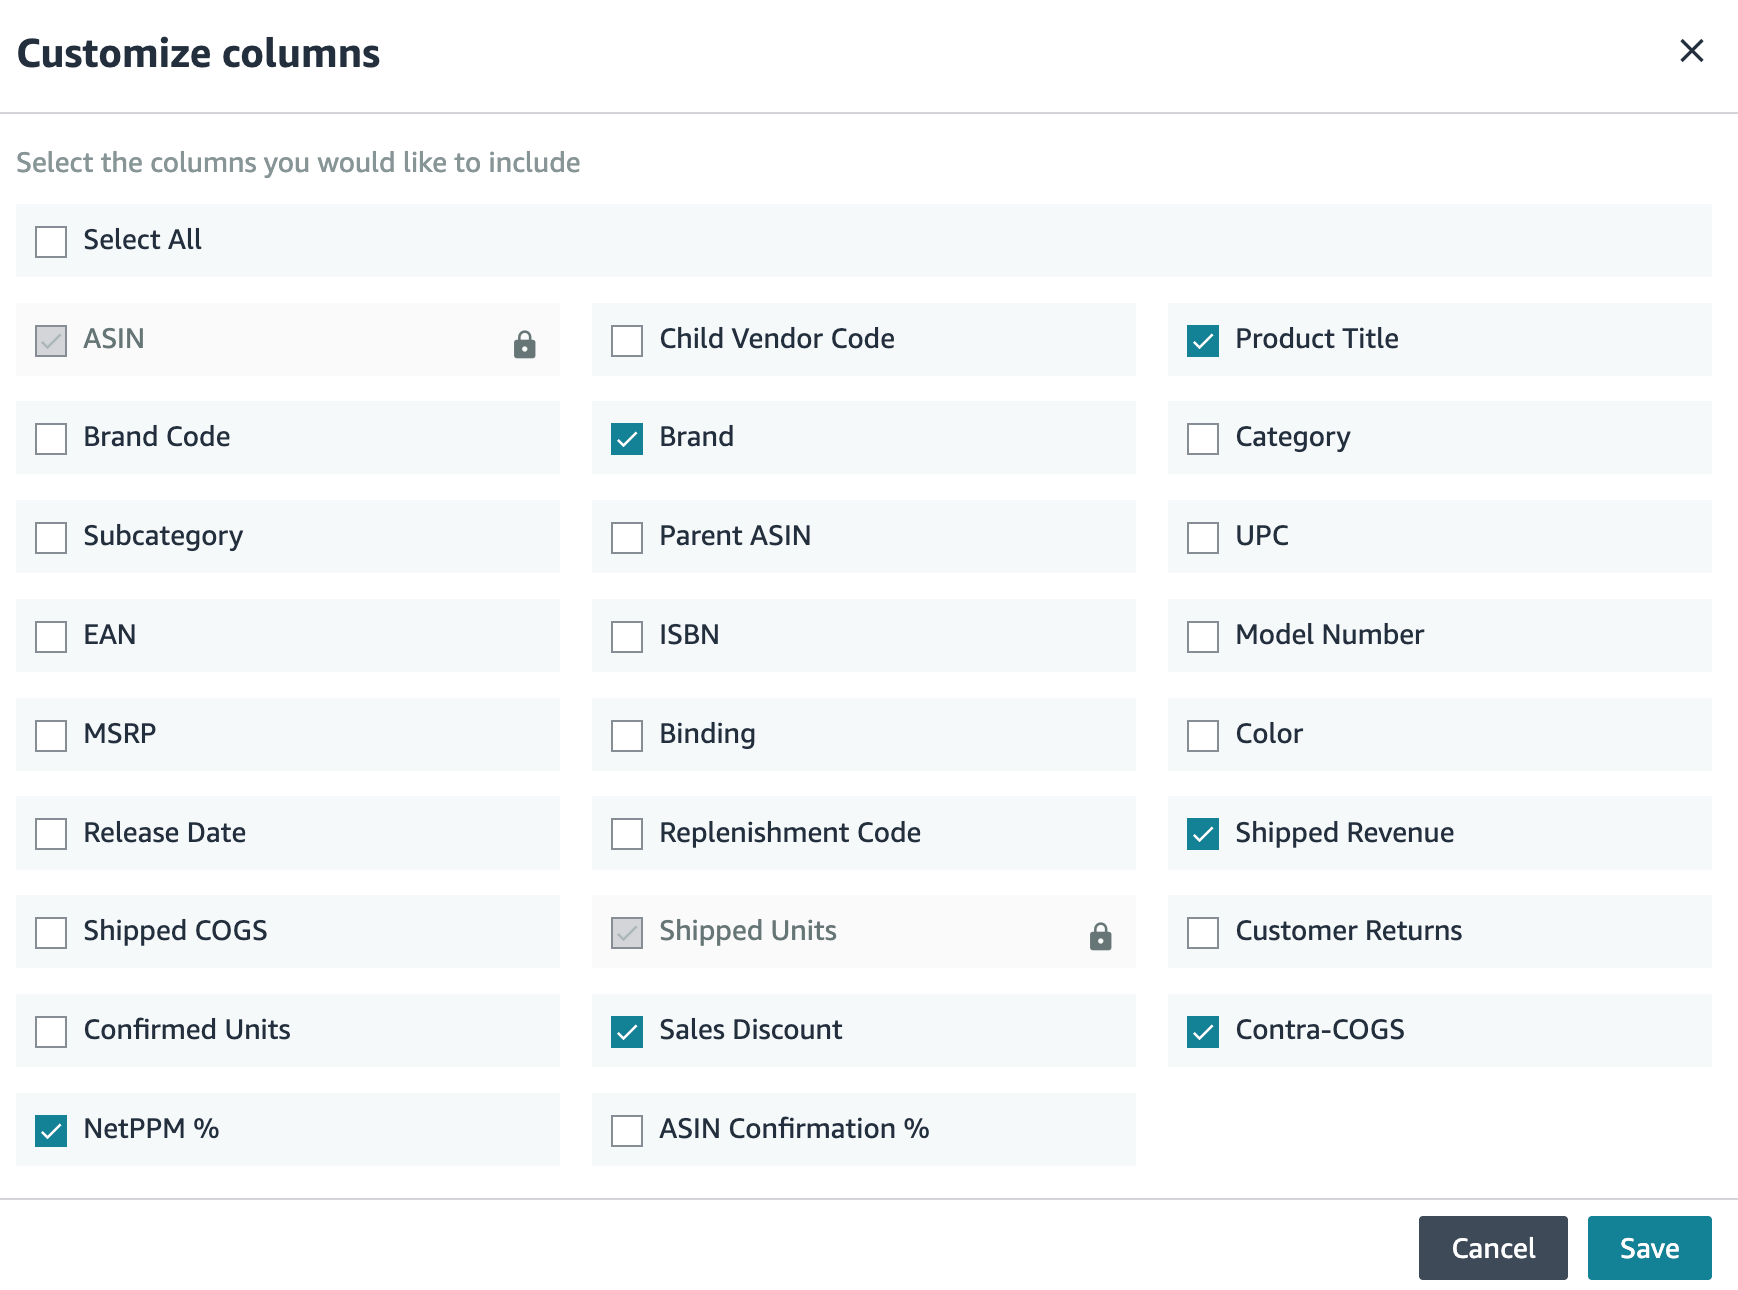
Step 2
Click “Customize columns” to bring up a list of all optional columns. All Net PPM columns like contra-COGS and Sales Discount are available in Sourcing view only.
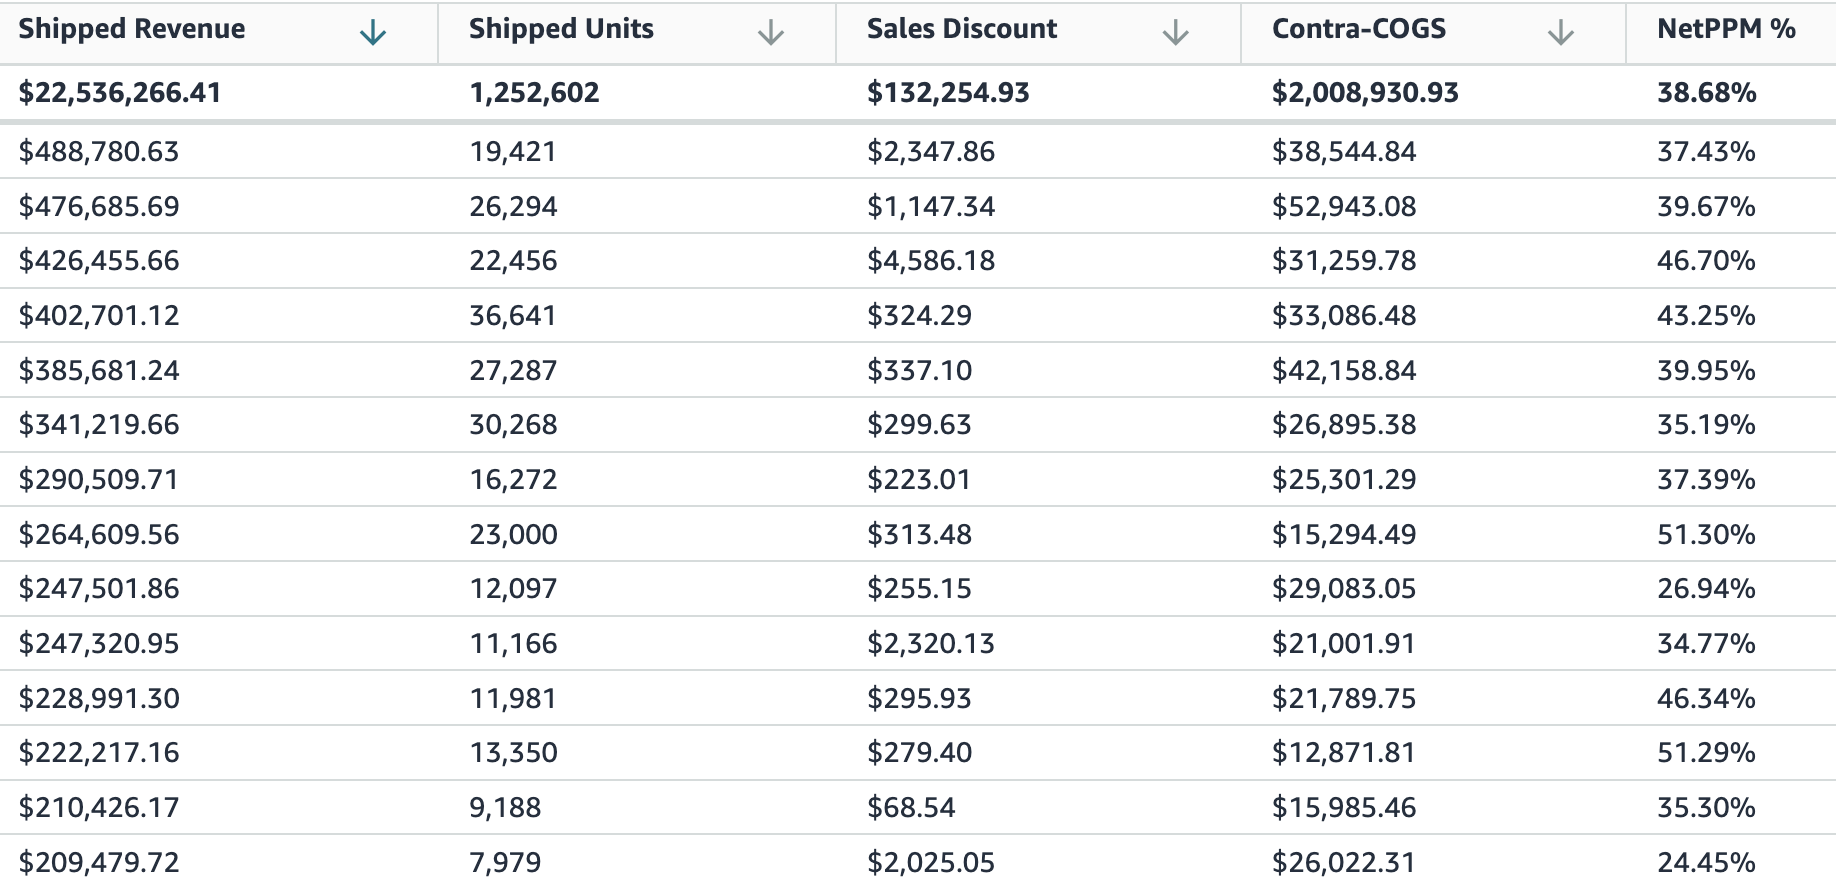
Step 3
Now you can have a complete view of your PPM metrics. Choose any granularity to dive deeper: ASIN, Vendor Code, Brand, or Amazon Category or Subcategory.
Contra-COGS issues
Your Retail Analytics data adds up correctly if you plug it into the Net PPM formula. However, it’s important to remember that the contra-COGS data in Retail Analytics is an approximation, not based on your actual coop deductions. This means that your reported Net PPM in Vendor Central is probably inaccurate!
How to Validate and Calculate Your Net PPM Using Deductions Data
For the most accurate view of your Net PPM, replace Amazon's reported contra-COGS from Retail Analytics, with your actual co-op deductions added up from the details of your payments from Amazon. Retail Analytics makes assumptions and estimates about your contracogs in order to provide fast Net PPM reporting. Your actual co-op deductions are the best source of truth because they are an accounting view of what Amazon actually deducted and why—no matter what your actual agreements say.
This method also captures co-op over- and underbillings. For example, if you sell in multiple categories, a single ASIN might be incorrectly associated with co-op accruals for multiple categories. You pay more without getting credit for it.
Download your Net PPM data by product from Amazon, including the optional input columns: Net PPM%, shipped units, shipped revenue, shipped COGS, contra-COGS, and sales discount.
Multiply Net PPM % by shipped revenue to convert the PPM percentage into currency.
Download your remittance details from Amazon for the same time period and extract the line item details, e.g. using a chatbot.
Identify all contra-COGS transactions, using the transaction type and/or description field, along with their associated ASINs.
Add up the contra-COGS transactions by ASIN, and compare the total to the reported contra-COGS from Retail Analytics.
If Retail Analytics contra-COGS is higher: your net PPM might be lower (worse) than reported, due to Amazon underbilling you. It’s generally a good idea to bring this to Amazon’s attention because they have the right to audit and collect underbilled co-op later, which can be very disruptive to cash flow.
If Retail Analytics contra-COGS is lower: your net PPM might be higher (better) than reported. This can happen for any number of reasons (remember that the Retail Analytics value is an estimate), but is sometimes due to Amazon overbilling you, or a misattributed agreement.
Example Brand Analysis
In the screenshot above, a Reason Automation customer used BASIS to perform this PPM gap analysis as part of negotiation prep.
Retail Analytics showed a Net PPM% of 42.5% for this brand’s business, or $87,816,564 in cash profit.
However, we found a total of $118,926,457 in cash profit when we recalculated net PPM using the brand’s actual co-op deductions using the method above.
The difference of $31,109,893 would improve Net PPM from 42.5% to 54.5%.
Why does this matter? While it’s unlikely Amazon will simply write you a check for the difference, it’s an important baseline exercise for every negotiation because Amazon will almost always ask you to improve net PPM through cost reductions or funding increases. Performing your own PPM gap analysis helps you change the balance of power in the conversation by giving you a data-driven way to push back on Amazon’s narrative for terms increases. It incentivizes Amazon to perform better analyses of their own and revisit their proposals.
Strategies to Improve Net PPM
Amazon will always push for the most obvious, blunt levers for improving your Net PPM: reducing PO cost prices, and increasing contra-COGS funding. You can obviously improve your profitability through concessions on costs or terms, but what other options should brands consider?
Here are several key strategies for influencing PPM other than giving Amazon more money:
Limit price matches. Price matches are a major driver of unexpected PPM compression, whether Amazon is matching a competing retailer’s deal or a third-party seller.
Accept that Amazon’s price matching strategy isn’t going to change, and increase your control over the distribution and resale of your products
Remove low-PPM selection. Amazon asks for your entire catalog but that doesn’t mean you have to give it to them, or wait for them to flag your items as CRaP (Can’t Realize a Profit). If you have selection exerting disproportionate downward pressure on your PPM, consider getting rid of it or sending less to Amazon.
Drive sales of higher-PPM selection. You can use sponsored ads, deals, and off-Amazon media to drive sales of higher-PPM products, shifting your sales mix and effectively making your portfolio more profitable. This works especially well if you have many high-converting products without constrained inventory.
Make sure your co-op data is flowing correctly. You want to get full credit for all of the co-op you already pay. We always find discrepancies and they are often in the brand’s favor. Don’t wait for QBR or AVN to claim value or get this corrected.
What Net PPM Doesn’t Cover
While Net PPM is a critical metric for understanding and tracking Amazon’s profit margin on your products, it’s equally critical to recognize its limitations. By negotiating to Amazon’s PPM requests and implied benchmarks, you prioritize their profitability instead of the joint success of your businesses.
One core issue with overemphasizing Net PPM is that it often represents Amazon’s path of least resistance in negotiations. Reducing cost prices or increasing trade terms are straightforward demands, yet they might not support the long-term growth and resilience of a vendor's operations. Essential aspects, such as improving packaging for reduced damage rates, investing in supply chain efficiencies, or focusing on free cash flow growth—factors that can enhance overall profitability and operational health—are often sidelined in Net PPM-centric discussions. These elements, which contribute to a more balanced and durable vendor-Amazon relationship, fall outside the scope of Net PPM and may go unrecognized when it is the dominant focus.
As a brand, reframing these conversations with your Amazon Vendor Manager can help drive a more holistic approach to profitability. Instead of being restricted by cost-cutting or trade term adjustments, aim to address broader, sustainability-focused topics that impact profitability at a systemic level. By doing so, you can work towards a trade relationship that supports both immediate profitability and long-term business stability.
Setting Up for Data-Driven Net PPM Analysis
To effectively manage and improve your Net PPM, it’s important to establish a data-driven approach. Here are steps to set yourself up for success:
Automate data collection and analysis: Use Amazon’s Selling Partner API (SP-API) to automate retail analytics data retrieval, or outsource it to partners like Reason Automation.
Make PPM part of your weekly business review: don’t limit PPM analysis to a quarterly QBR prep activity! Look for drivers of PPM trends, especially year-over-year acceleration or deceleration. Our tools make this easy by mapping your ASINs to your own taxonomy and showing you PPM trends by custom category, brand, or product line.
Regularly validate Amazon’s reported PPM: use your co-op deduction data to recalculate PPM yourself. Doing this on a regular basis can help identify and resolve issues much faster than letting them accumulate until QBR or AVN. It also shows Amazon that you are more interested in accuracy and long-term mutual profitability, than short-term victories over your vendor manager.